Many mizer functions return values that depend on species and either size or
time. plot() creates a ggplot2 figure with one line for each species
showing the values against size or against time (depending on the type of
output). plotHover() creates an interactive version of the same figure.
Details
This works because the mizer functions that give values that depend on
species and size return an ArraySpeciesBySize object and those that
give values that depend on species and time return an ArrayTimeBySpecies
object. These objects have attributes that store the name of the value,
its units, and a reference to the MizerParams object that the value was
computed from. This allows the plots to be automatically labelled and
coloured appropriately.
To compare two mizer arrays in a single plot, use plot2(). To show the
relative difference between two arrays, use plotRelative().
All methods return a ggplot2 object, unless return_data = TRUE, in
which case they return the underlying data frame instead. plotHover()
returns a plotly object.
Arguments used by all methods:
speciesCharacter vector of species to include.
NULL(default) means all species.highlightName or vector of names of the species to be highlighted.
totalA boolean value that determines whether the total over all selected species is plotted as well. Default is
FALSE.backgroundA boolean value that determines whether background species are included. Ignored if the model does not contain background species. Default is
TRUE.return_dataIf
TRUE, return the data frame instead of the plot.log_xIf
TRUE, use a log10 x-axis. The default depends on the method; see its own help page.log_yIf
TRUE, use a log10 y-axis. The default depends on the method; see its own help page.logCharacter string specifying which axes should use log10 scales, in the same form as the base
plot()argument. For example,"x","y","xy"or"". If supplied, this overrideslog_xandlog_y.ylimA numeric vector of length two providing lower and upper limits for the value (y) axis. Use
NAto refer to the existing minimum or maximum.y_ticksThe approximate number of ticks desired on the y axis.
Additional arguments for plot.ArraySpeciesBySize() and
plot.ArrayTimeBySpeciesBySize():
all.sizesIf
FALSE(default), values outside a species' size range (w_mintow_max) are removed.wlimA numeric vector of length two providing lower and upper limits for the weight (x) axis. Use
NAto refer to the existing minimum or maximum.llimA numeric vector of length two providing lower and upper limits for the length (x) axis when
size_axis = "l". UseNAto refer to the existing minimum or maximum.size_axisWhether to plot size as weight (
"w", default) or length ("l"), using the allometric weight-length relationship.
Additional argument for plot.ArrayTimeBySpecies():
tlimA numeric vector of length two providing lower and upper limits for the time axis, e.g.
c(1980, 2000). UseNAto apply no limit at that end. Default isc(NA, NA).
Additional argument for plot.ArrayTimeBySpeciesBySize() and
plot.ArrayTimeByResourceBySize():
timeThe time to display. Default (
NULL) is the final time step.
See the individual method help pages for each method's exact arguments and
defaults: plot.ArraySpeciesBySize(), plot.ArrayTimeBySpecies(),
plot.ArrayTimeBySpeciesBySize(), plot.ArrayResourceBySize(),
plot.ArrayTimeByResourceBySize().
See also
Other plotting functions:
addPlot(),
animate.ArrayTimeBySpeciesBySize(),
plot2(),
plotBiomass(),
plotCDF(),
plotCDF2(),
plotDiet(),
plotFMort(),
plotFeedingLevel(),
plotGrowthCurves(),
plotMizerParams,
plotMizerSim,
plotPredMort(),
plotRelative(),
plotSpectra(),
plotSpectra2(),
plotSpectraRelative(),
plotYield(),
plotYieldGear(),
plotting_functions
Examples
# \donttest{
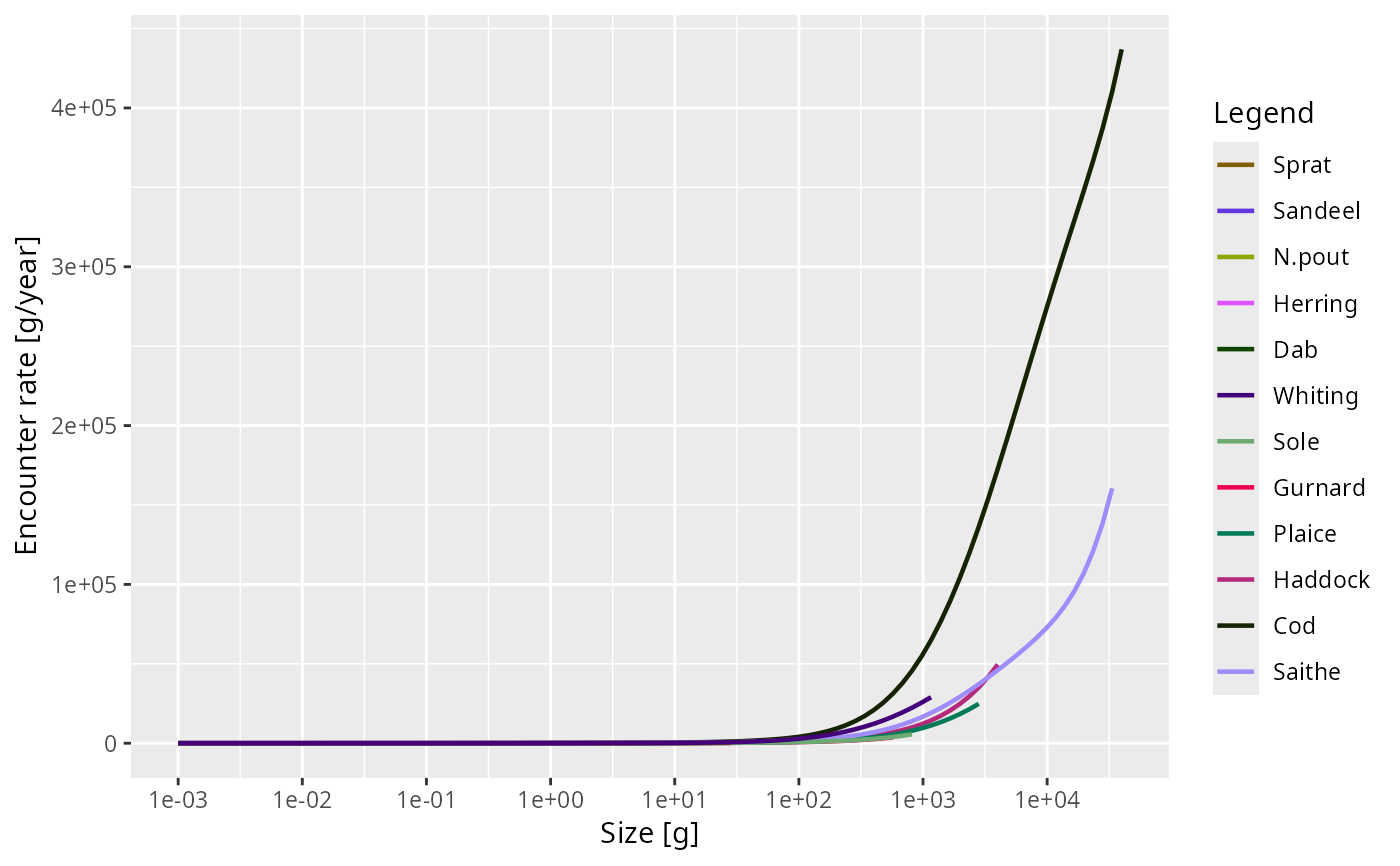
plot(getEncounter(NS_params))
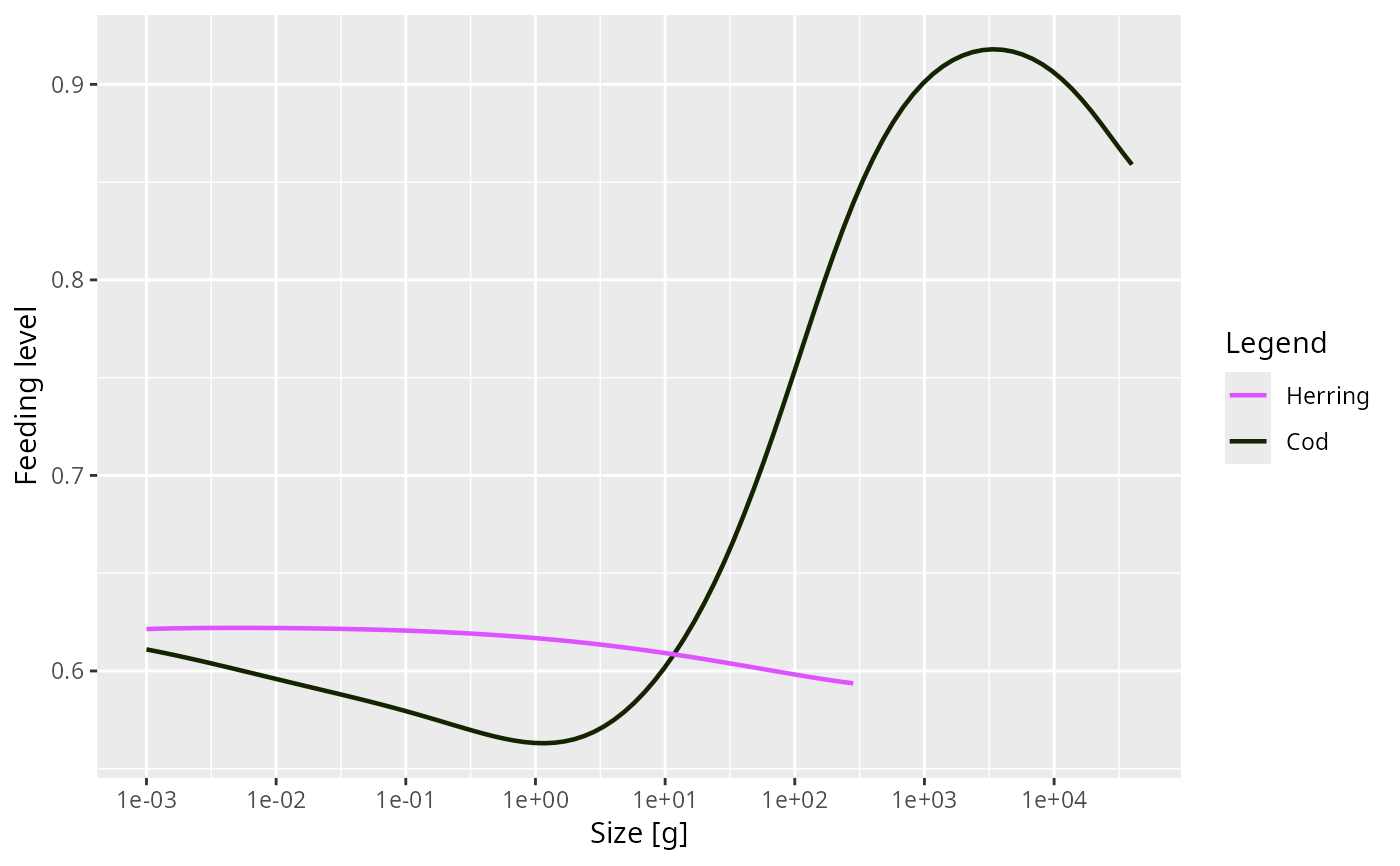
 plot(getFeedingLevel(NS_params), species = c("Cod", "Herring"))
 plot(getPredMort(NS_params), species = c("Cod", "Herring"),
size_axis = "l")
plot(getPredMort(NS_params), species = c("Cod", "Herring"),
size_axis = "l")
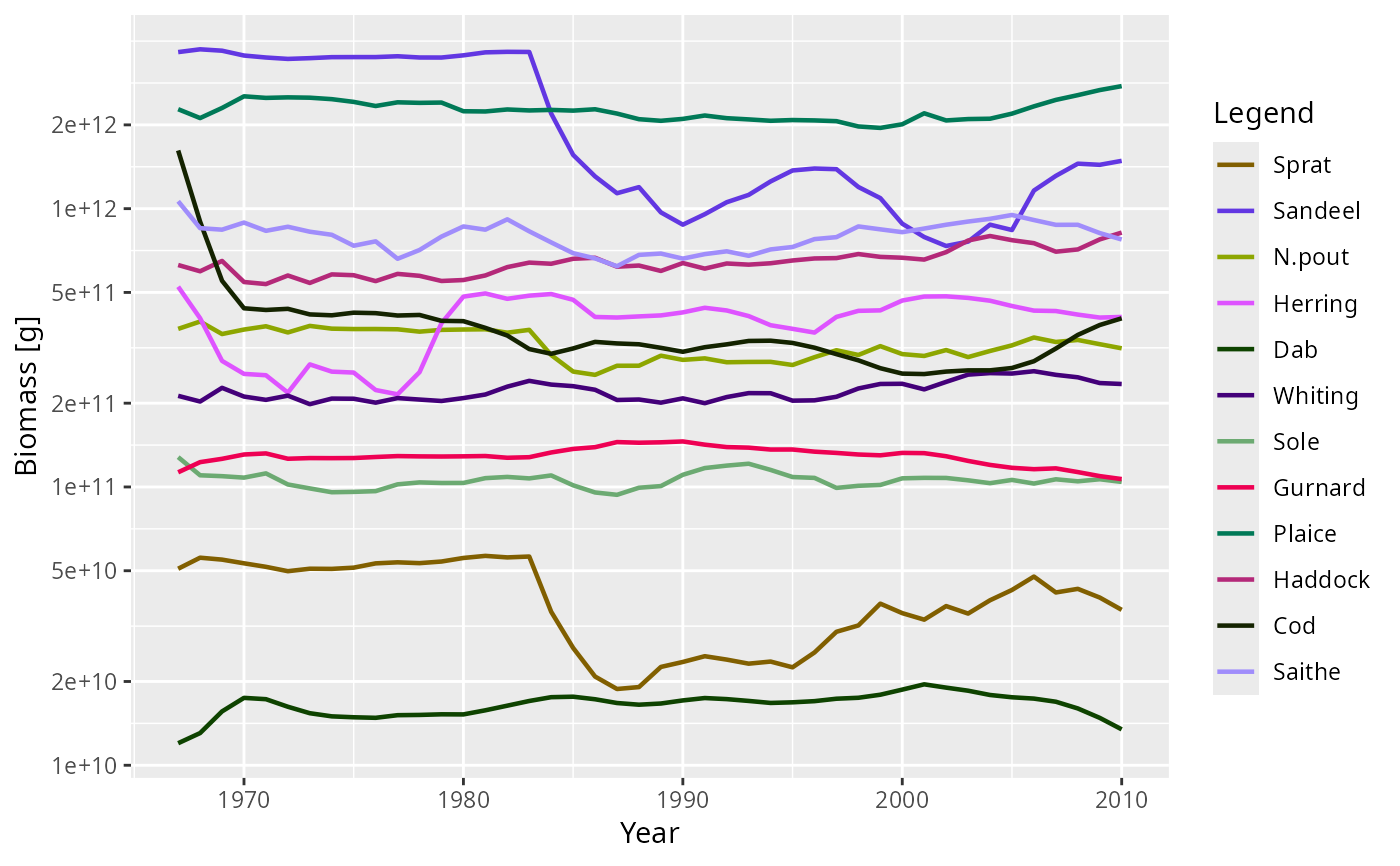 plot(getBiomass(NS_sim))
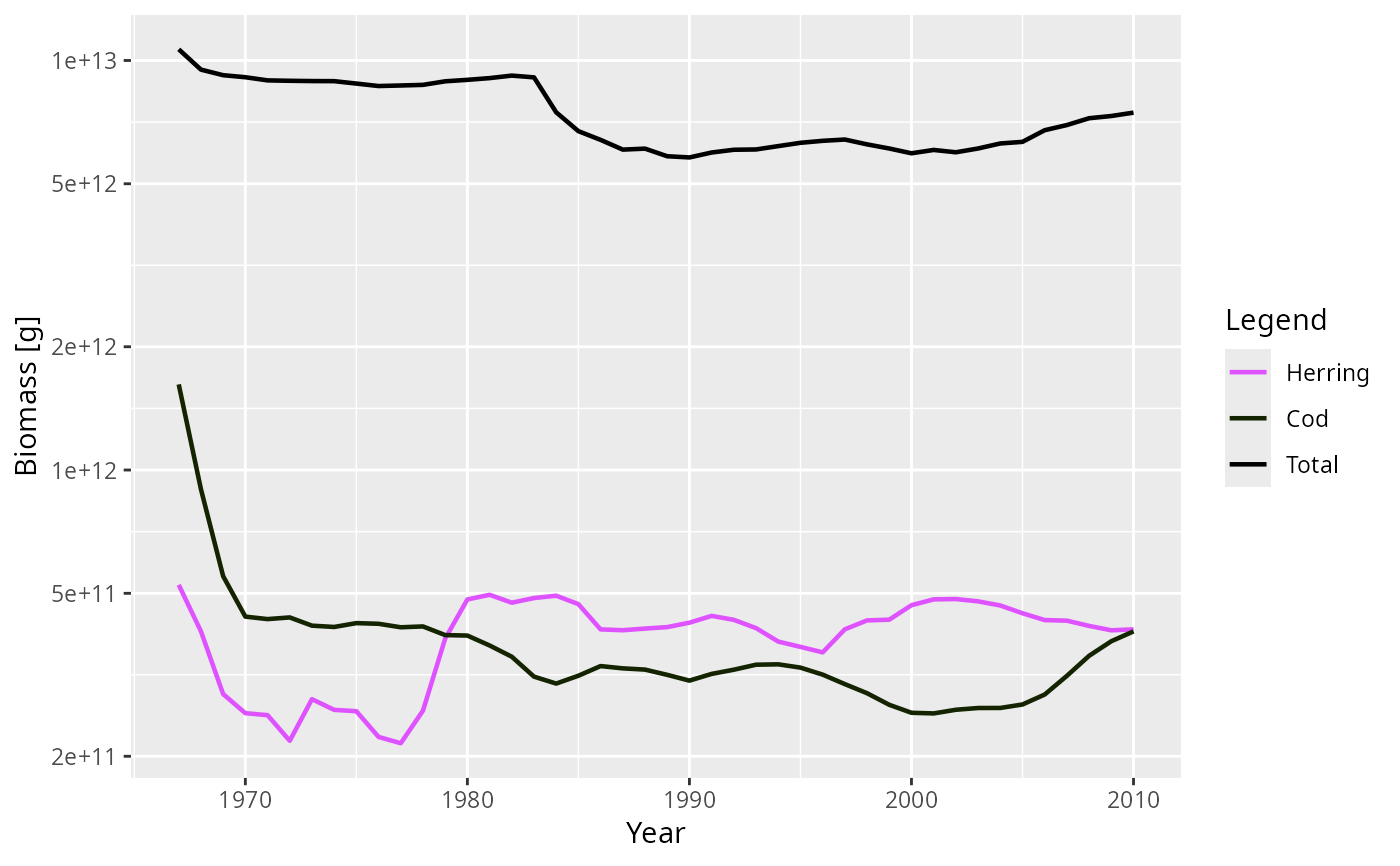 plot(getBiomass(NS_sim), species = c("Cod", "Herring"), total = TRUE)
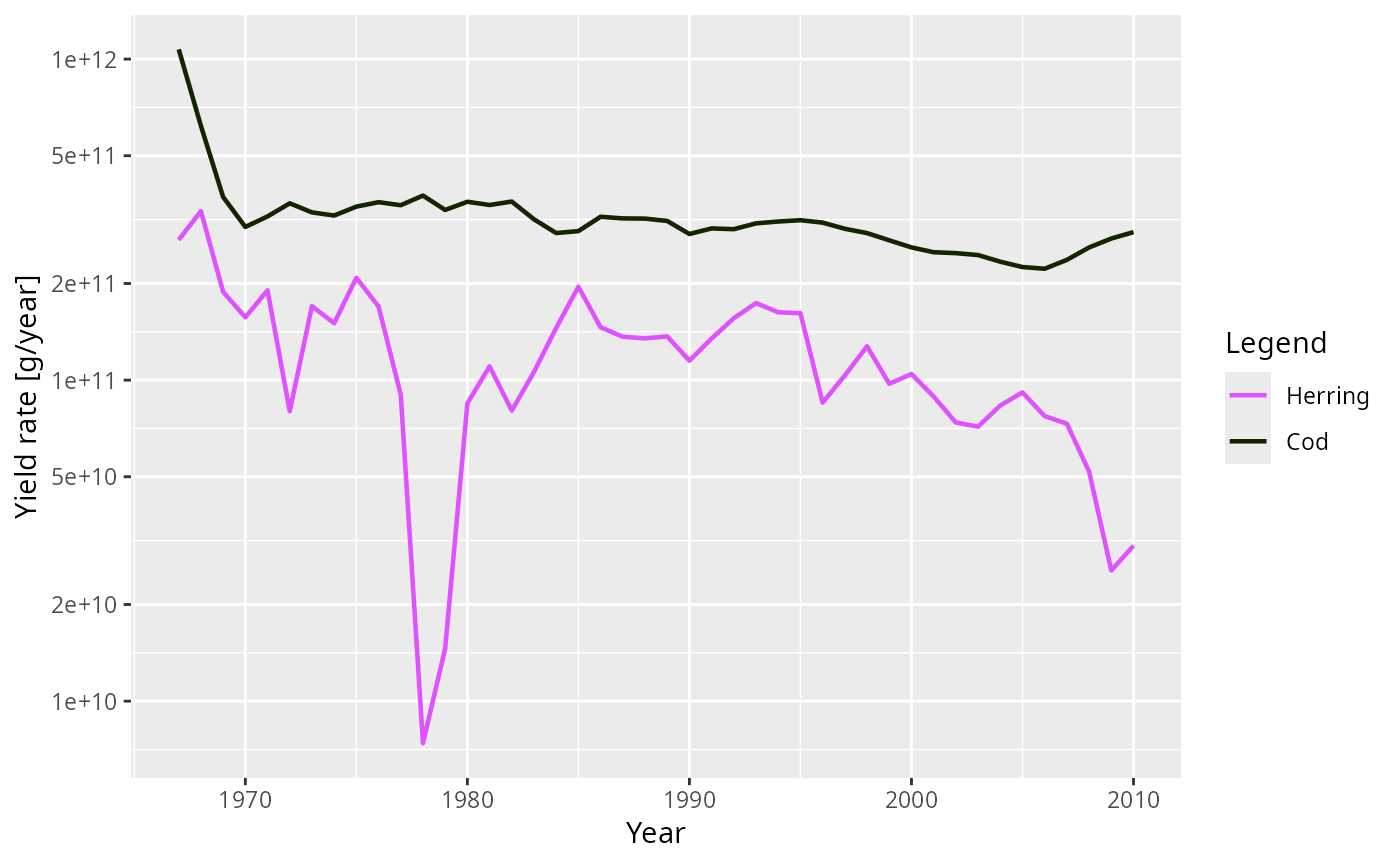 plot(getYield(NS_sim), species = c("Cod", "Herring"))
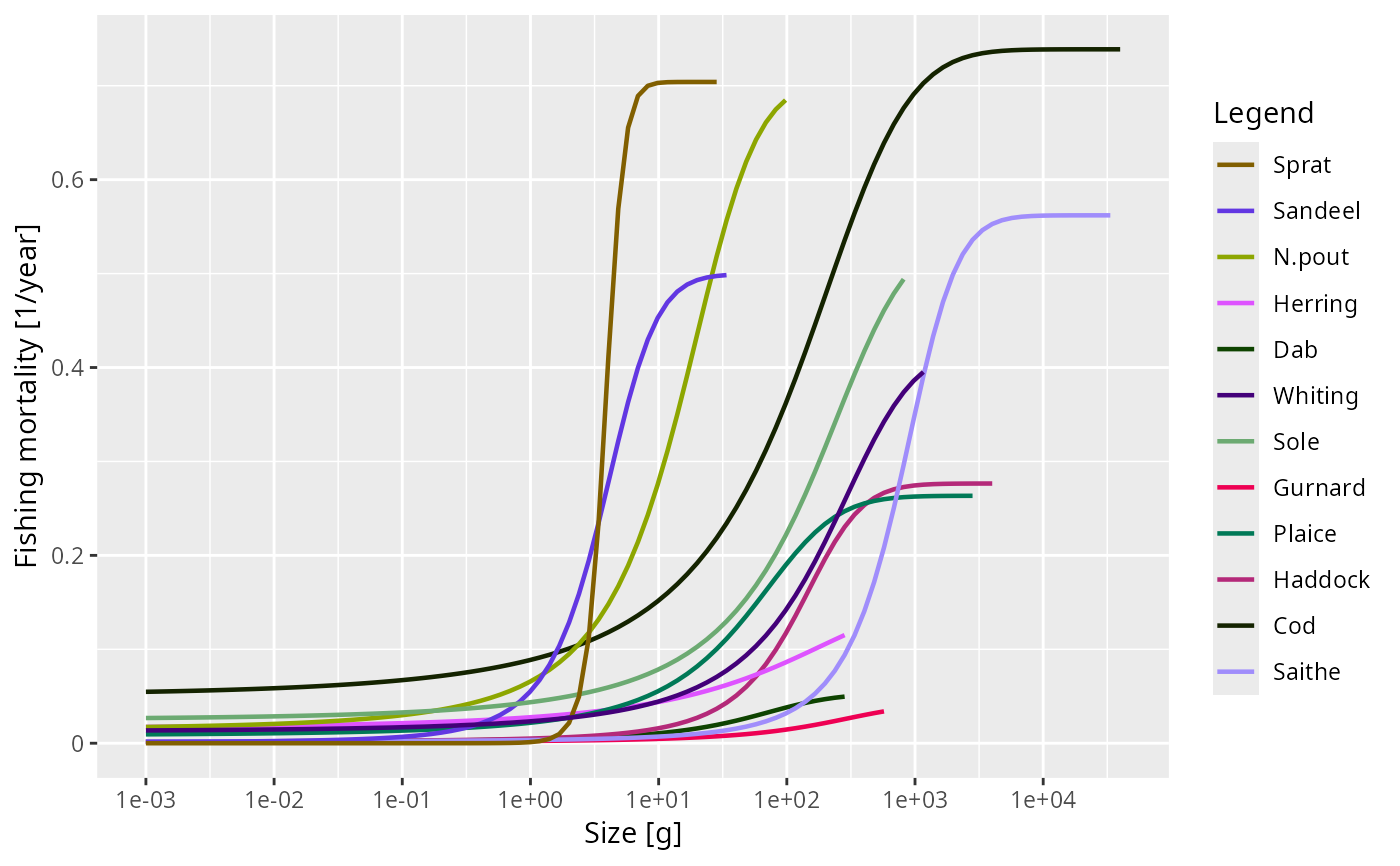
 plot(getFMort(NS_sim), time = 2010)
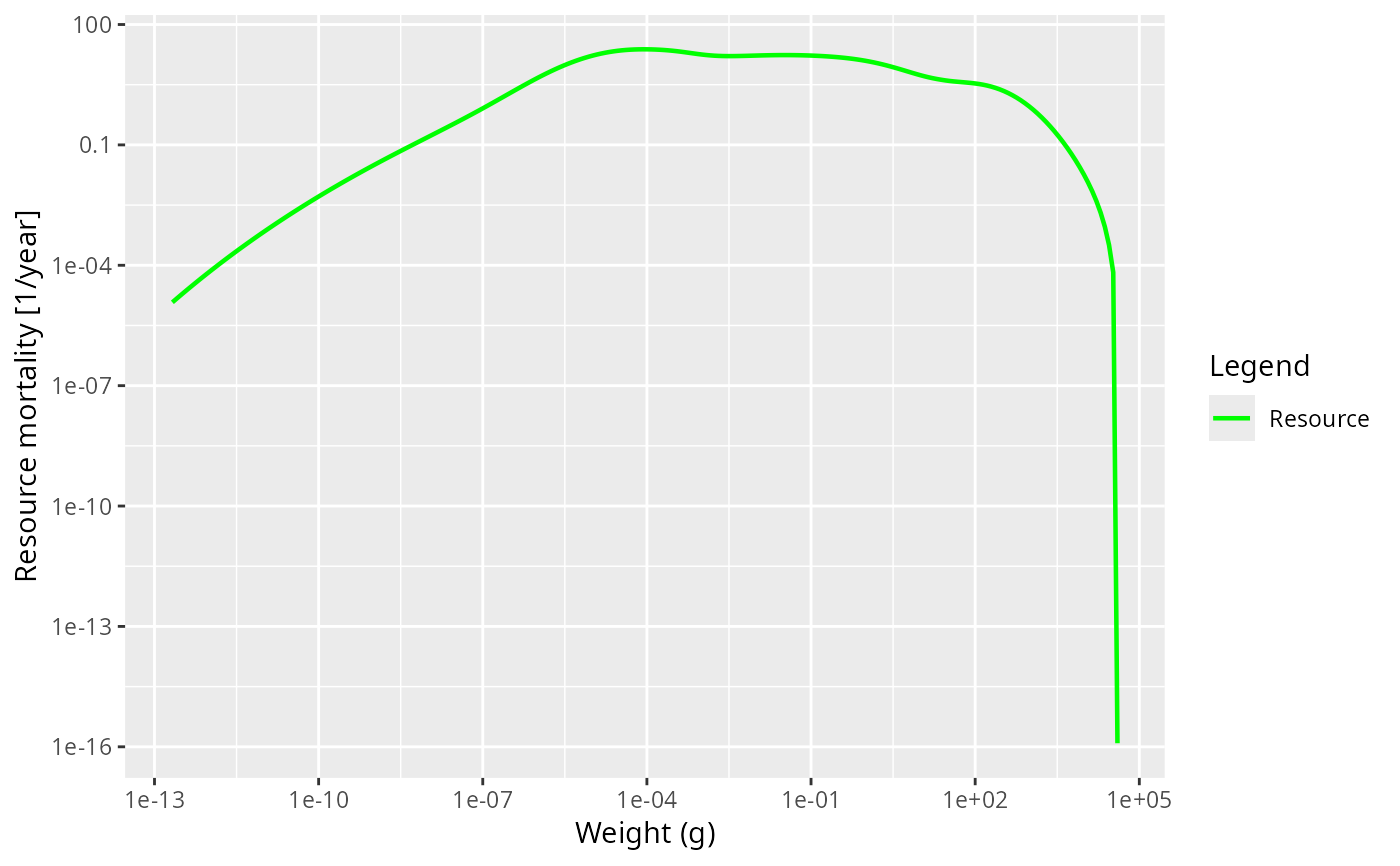
 plot(getResourceMort(NS_params))
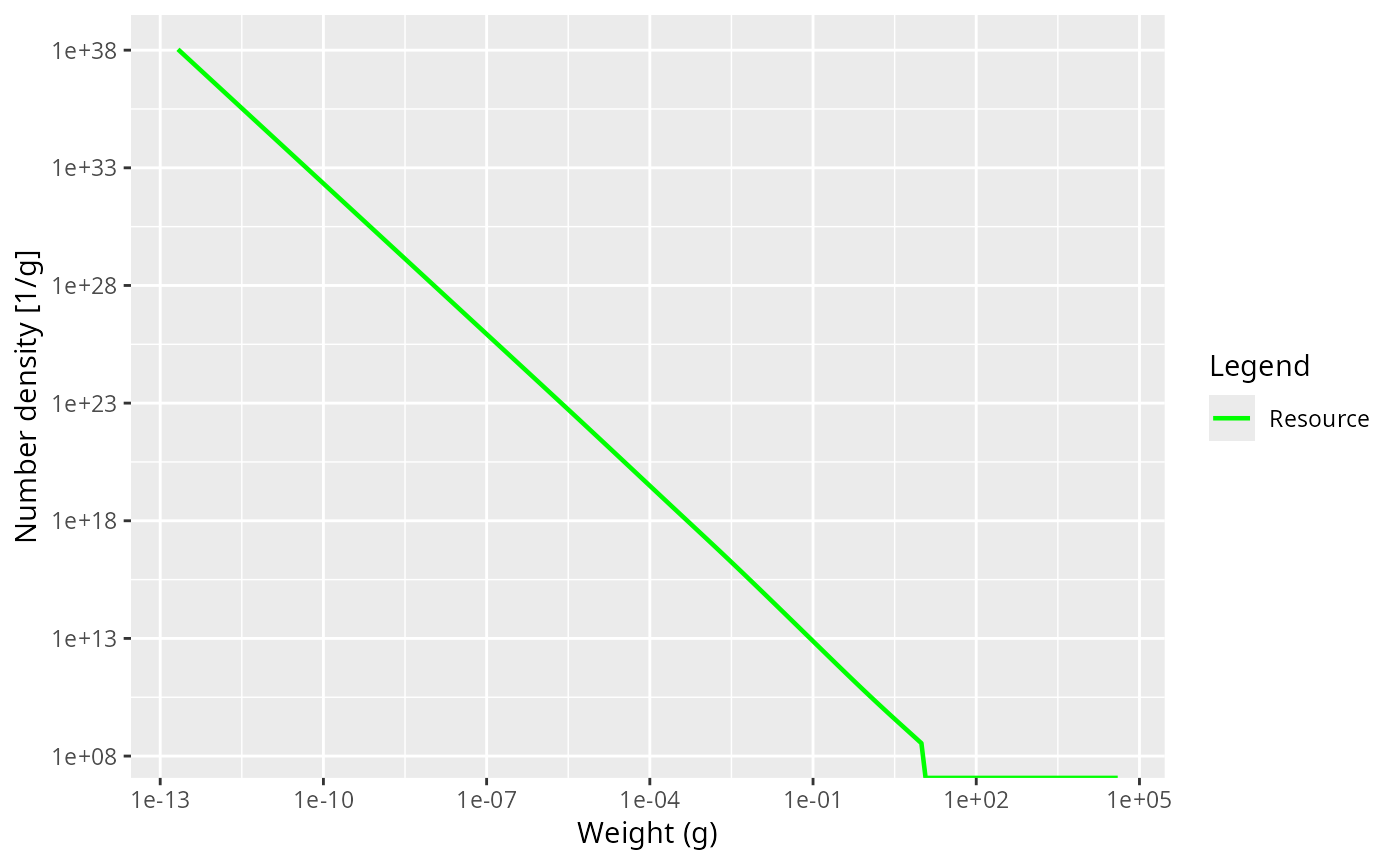
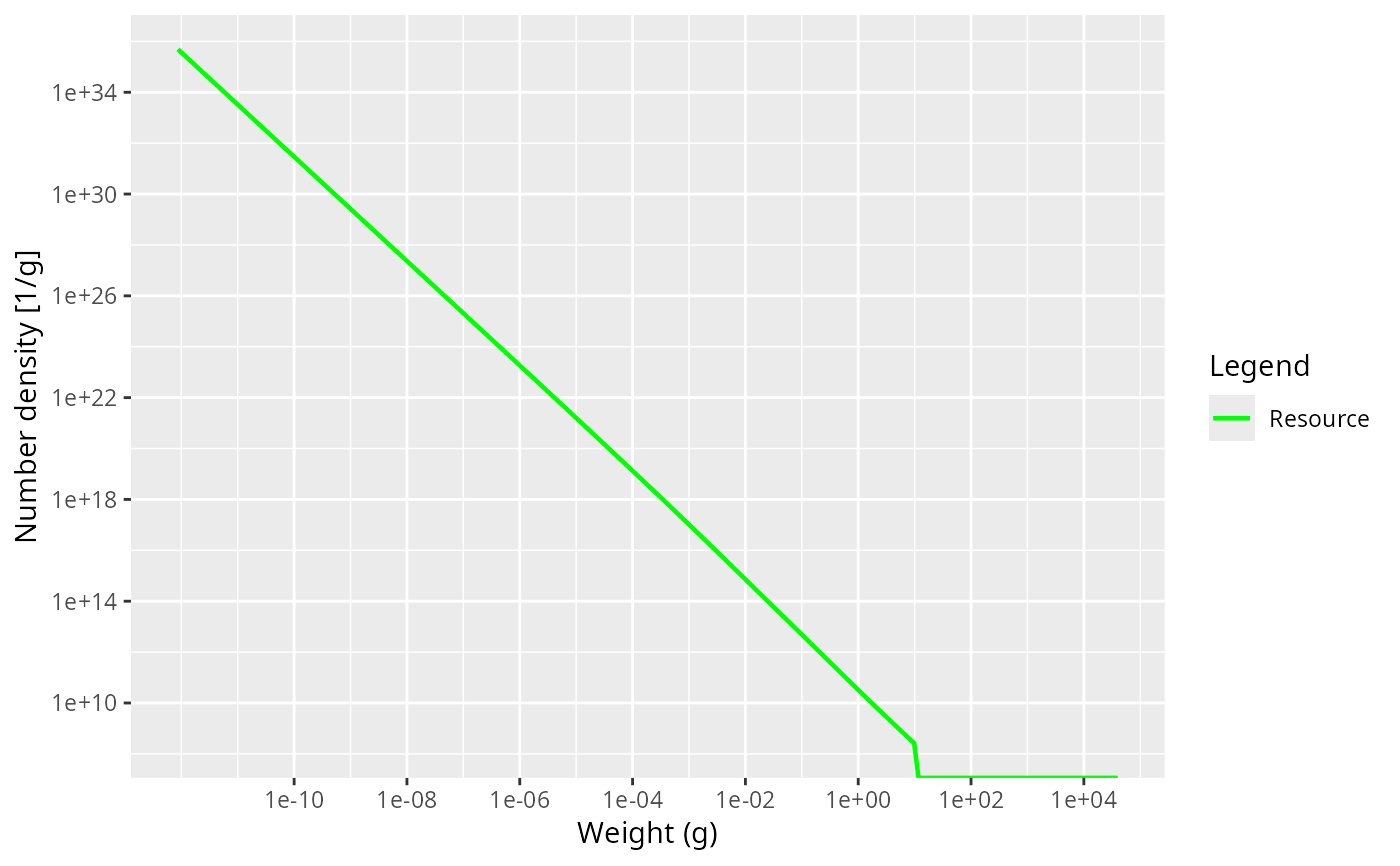
 plot(initialNResource(NS_params))
#> Warning: log-10 transformation introduced infinite values.
plot(initialNResource(NS_params))
#> Warning: log-10 transformation introduced infinite values.
 plot(NResource(NS_sim))
#> Warning: log-10 transformation introduced infinite values.
plot(NResource(NS_sim))
#> Warning: log-10 transformation introduced infinite values.
 # }
# }