
This vignette describes an analytical test for the transport equation solver used in mizer.
The transport equation
The time evolution of the size spectrum \(N(w)\) is described by the McKendrick-von Foerster equation with an added diffusion term:
\[\begin{equation} \frac{\partial N}{\partial t} + \frac{\partial}{\partial w} \left( g N - \frac{1}{2}\frac{\partial(D N)}{\partial w} \right) = -\mu N, \end{equation}\]
where \(g(w)\) is the growth rate, \(\mu(w)\) is the mortality rate and \(D(w)\) is the diffusion rate.
We will look for a solutions when the rates are power laws of the form:
\[\begin{align} g(w) &= A w^p, \\ \mu(w) &= B w^{p-1}, \\ D(w) &= K w^{p+1}. \end{align}\]
Analytical steady-state solution
We try a power-law ansatz for the solution: \[ N(w) = C w^{-\lambda}. \] Substituting these forms into the transport equation at steady state (\(\partial N / \partial t = 0\)):
\[ \frac{\partial}{\partial w} \left( A w^p C w^{-\lambda} - \frac{1}{2}\frac{\partial}{\partial w}(K w^{p+1} C w^{-\lambda}) \right) = - B w^{p-1} C w^{-\lambda}. \]
We simplify the term inside the derivative: \[ D N = K C w^{p+1-\lambda}, \] \[ \frac{\partial(D N)}{\partial w} = K C (p+1-\lambda) w^{p-\lambda}, \] \[ g N - \frac{1}{2}\frac{\partial(D N)}{\partial w} = \left( A - \frac{1}{2} K (p+1-\lambda) \right) C w^{p-\lambda}.\] Thus the flux is \(J = J_0 w^{p-\lambda}\) with \(J_0 = C \left( A - \frac{1}{2} K (p+1-\lambda) \right)\).
Differentiating the flux with respect to \(w\) gives \[ \frac{\partial J}{\partial w} = J_0 (p-\lambda) w^{p-\lambda-1}. \]
The RHS is \[ -\mu N = - B C w^{p-1-\lambda}. \]
Equating LHS and RHS gives \[ C \left( A - \frac{1}{2} K (p+1-\lambda) \right) (p-\lambda) w^{p-\lambda-1} = - B C w^{p-\lambda-1}. \]
Dividing by \(C w^{p-\lambda-1}\) (assuming \(C \neq 0\) and \(w \neq 0\)): \[ \left( A - \frac{1}{2} K (p+1-\lambda) \right) (p-\lambda) + B = 0. \]
Let \(x = p - \lambda\). Then \(p + 1 - \lambda = x + 1\). The equation becomes: \[ \left( A - \frac{1}{2} K (x+1) \right) x + B = 0. \] or, equivalently, \[ Ax - \frac{1}{2} K x^2 - \frac{1}{2} K x + B = 0. \] We multiply by -2: \[ K x^2 - (2A - K) x - 2B = 0. \]
This is a quadratic equation for \(x = p - \lambda\). The solutions are: \[ x = \frac{(2A - K) \pm \sqrt{(2A - K)^2 + 8KB}}{2K}.\]
We are interested in the solution that corresponds to the limit of small diffusion \(K \to 0\). In that limit, \(g N \sim C A w^{p-\lambda}\) and \(\frac{\partial (gN)}{\partial w} \sim C A (p-\lambda) w^{p-\lambda-1}\). The transport equation without diffusion is \(\frac{\partial (gN)}{\partial w} = -\mu N\). \[ A (p-\lambda) = -B \implies x = p-\lambda = -B/A. \] Since \(A, B > 0\), \(x\) should be negative. Let’s check the roots. \((2A-K)^2 + 8KB > (2A-K)^2\), so the square root is larger than \(|2A-K|\). The term \((2A-K)\) is positive for small \(K\). The positive root is \(\frac{(2A-K) + \text{larger}}{2K} > 0\). The negative root is \(\frac{(2A-K) - \text{larger}}{2K} < 0\). So we need the negative root:
\[ \begin{split} \lambda &= p - \frac{(2A - K) - \sqrt{(2A - K)^2 + 8KB}}{2K}\\ &=p + \frac{4B}{(2A - K) + \sqrt{(2A - K)^2 + 8KB}}. \end{split} \] The second expression above is better for numerical evaluation because it avoids the subtraction of two similarly sized numbers.
Numerical verification
We verify this analytical solution by considering a single species in
mizer and checking if the project() function keeps the
system in this steady state. First we set up a mizer model with the
power law rates:
library(mizer)

# Parameters
p <- 0.7
A <- 1
B <- 0.5
K <- 0.1

# Calculate lambda
# coefficients for K x^2 - (2A - K) x - 2B = 0
a_quad <- K
b_quad <- -(2*A - K)
c_quad <- -2*B

det <- b_quad^2 - 4 * a_quad * c_quad
x <- 4 * B / (-b_quad + sqrt(det))
lambda <- p + x

# Set up mizer params
# We create a dummy species
sp <- data.frame(species = "Test",
                 w_max = 1000,
                 w_mat = 100)
params <- newMultispeciesParams(sp, no_w = 1000, min_w = 1e-3,
                                info_level = 0)

# Set initial N to analytical solution
initialN(params) <- matrix(w(params)^(-lambda), nrow = 1, byrow = TRUE)

# Define custom rate functions
# Growth
start_growth <- function(params, ...) {
    matrix(A * params@w^p, nrow = 1, byrow = TRUE)
}
params <- setRateFunction(params, "EGrowth", "start_growth")

# Mort
start_mort <- function(params, ...) {
    matrix(B * params@w^(p - 1), nrow = 1, byrow = TRUE)
}
params <- setRateFunction(params, "Mort", "start_mort")

# Diffusion
ext_diffusion(params)[1, ] <- K * w(params)^(p + 1)

# RDD (Constant Flux)
params@species_params$constant_reproduction <- getRequiredRDD(params)
params <- setRateFunction(params, "RDD", "constantRDD")
We can now project this forward in time and check that the result stays the same.
# Run project
# We verify that N stays constant.
sim <- project(params, t_max = 1, dt = 0.1, method = "predictor-corrector")

# Compare final N with initial N
n0 <- initialN(params)[1, ]
n1 <- finalN(sim)[1, ]

# Plot
plot(w(params), n0, log="xy", type="l", col="blue", lwd=2,
     main="Comparison of numerical and analytical solution",
     xlab="Size", ylab="Density")
lines(w(params), n1, col="red", lty=2, lwd=2)
legend("topright", legend=c("Analytical", "Numerical"),
       col=c("blue", "red"), lty=c(1, 2))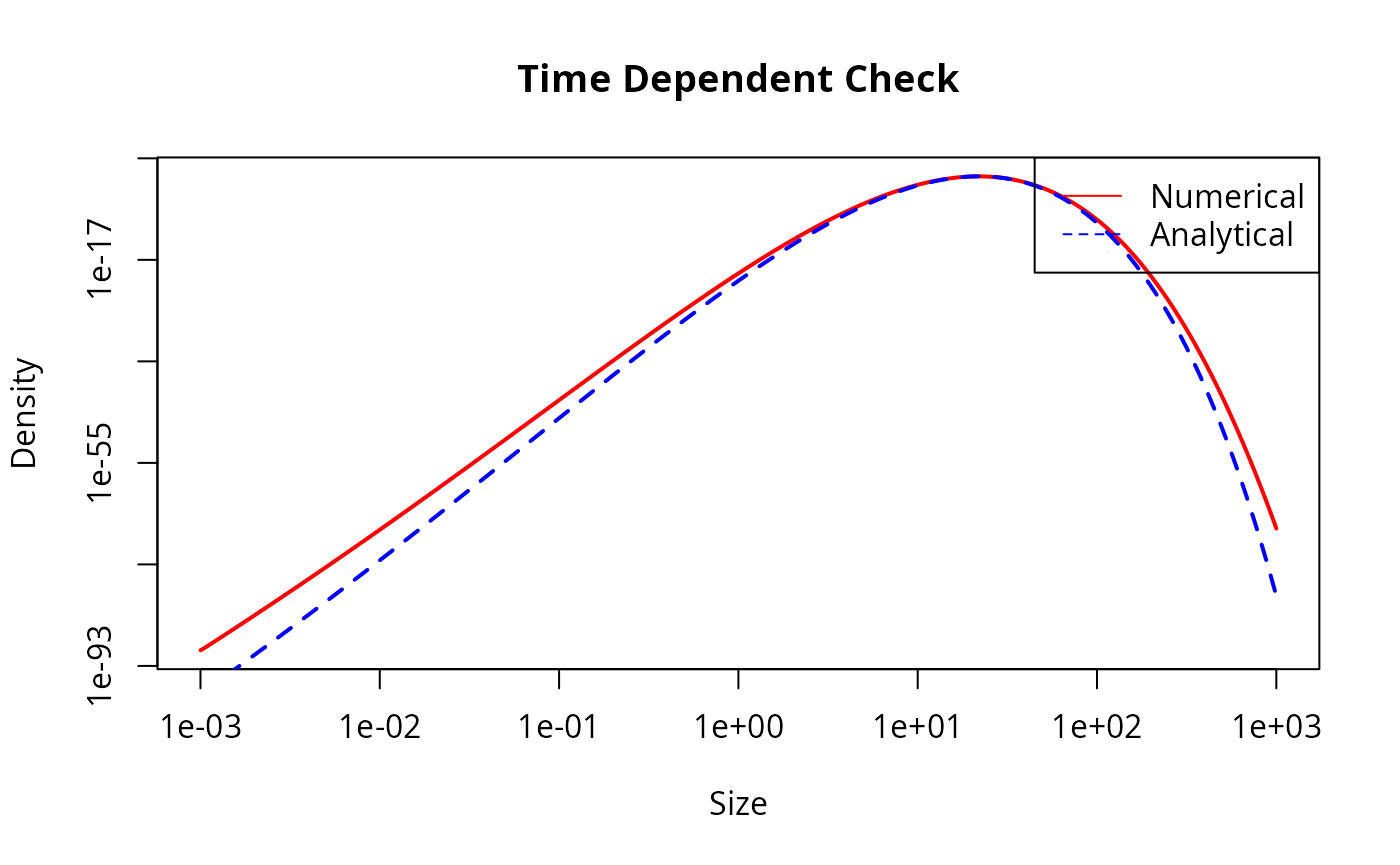
# Calculate relative error
rel_err <- abs(n1 - n0) / n0
# ignore last 100 bins because they are affected by the right boundary
max_rel_err <- max(rel_err[1:980])
print(paste("Maximum relative error:", max_rel_err))
#> [1] "Maximum relative error: 0.00596547751519771"

if (max_rel_err < 0.01) {
  print("Test passed: Numerical solution stays close to analytical steady state.")
} else {
  print("Test failed: Numerical solution deviates from analytical steady state.")
}
#> [1] "Test passed: Numerical solution stays close to analytical steady state."
Time-dependent analytical solution
To facilitate an analytical solution for time-dependent problems, we first transform the size variable \(w\) to a new variable \(x\): \[ x = \frac{w^{1-p}}{1-p}. \] Assuming \(p \neq 1\). Then \(w = ((1-p)x)^{\frac{1}{1-p}}\) and \(\frac{dx}{dw} = w^{-p}\).
We define the density in \(x\)-space, \(\tilde{N}(x, t)\), such that \(\tilde{N}(x, t) dx = N(w, t) dw\). Thus \[ \tilde{N}(x, t) = N(w, t) \frac{dw}{dx} = N(w, t) w^p. \]
Substituting this into the transport equation and simplifying leads to a PDE of the form: \[ \frac{\partial \tilde{N}}{\partial t} = V x \frac{\partial^2 \tilde{N}}{\partial x^2} + (V - U) \frac{\partial \tilde{N}}{\partial x} - \frac{b}{x} \tilde{N} ,\] where \(U = A - \frac{1}{2}K\), \(V = \frac{1}{2} K (1-p)\), \(b = \frac{B}{1-p}\).
The fundamental solution (Green’s function) for this equation, describing the evolution of an initial Dirac delta distribution \(\tilde{N}(x, 0) = \delta(x - x_0)\), is given by \[ G(x, t; x_0) = \frac{1}{Vt} \left( \frac{x}{x_0} \right)^{\frac{U}{2V}} \exp\left( -\frac{x+x_0}{Vt} \right) I_\nu \left( \frac{2\sqrt{xx_0}}{Vt} \right), \] where \(I_\nu\) is the modified Bessel function of the first kind of order \(\nu\), given by \[ \nu = \frac{1}{V} \sqrt{U^2 + 4Vb} .\]
The solution in terms of the original size distribution \(N(w, t)\) is then \[ N(w, t) = G(x(w), t; x(w_0)) w^{-p} .\]
Numerical verification
We verify this time-dependent solution by starting the simulation with the analytical distribution at a small time \(t_{start} > 0\) (to avoid the singularity at \(t=0\)) and projecting it to a later time \(t_{end}\).
# Function to calculate N analytic
N_analytic <- function(w, t, w0, t0, K_eff = 0.1) {
  # Parameters
  p <- 0.7
  A <- 1
  B <- 0.5

  # Transformed parameters
  U <- A - 0.5 * K_eff
  V <- 0.5 * K_eff * (1 - p)
  b <- B / (1 - p)
  nu <- sqrt((U/V)^2 + 4 * b / V)

  # Time elapsed
  dt <- t - t0
  if (dt <= 0) stop("t must be greater than t0")

  # Transform to x
  x <- w^(1 - p) / (1 - p)
  x0 <- w0^(1 - p) / (1 - p)

  # Argument for Bessel
  z <- 2 * sqrt(x * x0) / (V * dt)

  # Logarithm of N_tilde using scaled Bessel to avoid overflow
  bessel_scaled <- besselI(z, nu, expon.scaled = TRUE)

  log_N_tilde <- -log(V * dt) +
                 (U / (2 * V)) * log(x / x0) -
                 (x + x0) / (V * dt) +
                 z +
                 log(bessel_scaled)

  N_tilde <- exp(log_N_tilde)

  # Transform back to N(w)
  N <- N_tilde * w^(-p)

  return(N)
}
# Initial Condition
w0 <- 1e-2
t_start <- 0.1
t_end <- 2

# Set initial N from analytical solution
initial_n <- N_analytic(w(params), t_start, w0, 0)
initialN(params) <- matrix(initial_n, nrow = 1, byrow = TRUE)
We can simplify the left boundary condition because it is far enough away from the Gaussian for us to set the solution to 0 there.
# Set RDD to 0
params@species_params$constant_reproduction <- 0
params <- setRateFunction(params, "RDD", "constantRDD")
Now we project forward in time.
# Run project
sim <- project(params, t_max = t_end - t_start, dt = 0.05,
               t_save = t_end - t_start,
               method = "predictor-corrector")

# Compare
final_n_num <- finalN(sim)[1, ]
final_n_ana <- N_analytic(w(params), t_end, w0, 0)

# Plot
plot(w(params), final_n_num, log = "x", type = "l", col = "red", lwd = 2,
     main = "Time Dependent Check", xlab = "Size", ylab = "Density")

lines(w(params), final_n_ana, col = "blue", lty = 2, lwd = 2)
legend("topright", legend = c("Numerical", "Analytical"),
       col = c("red", "blue"), lty = c(1, 2))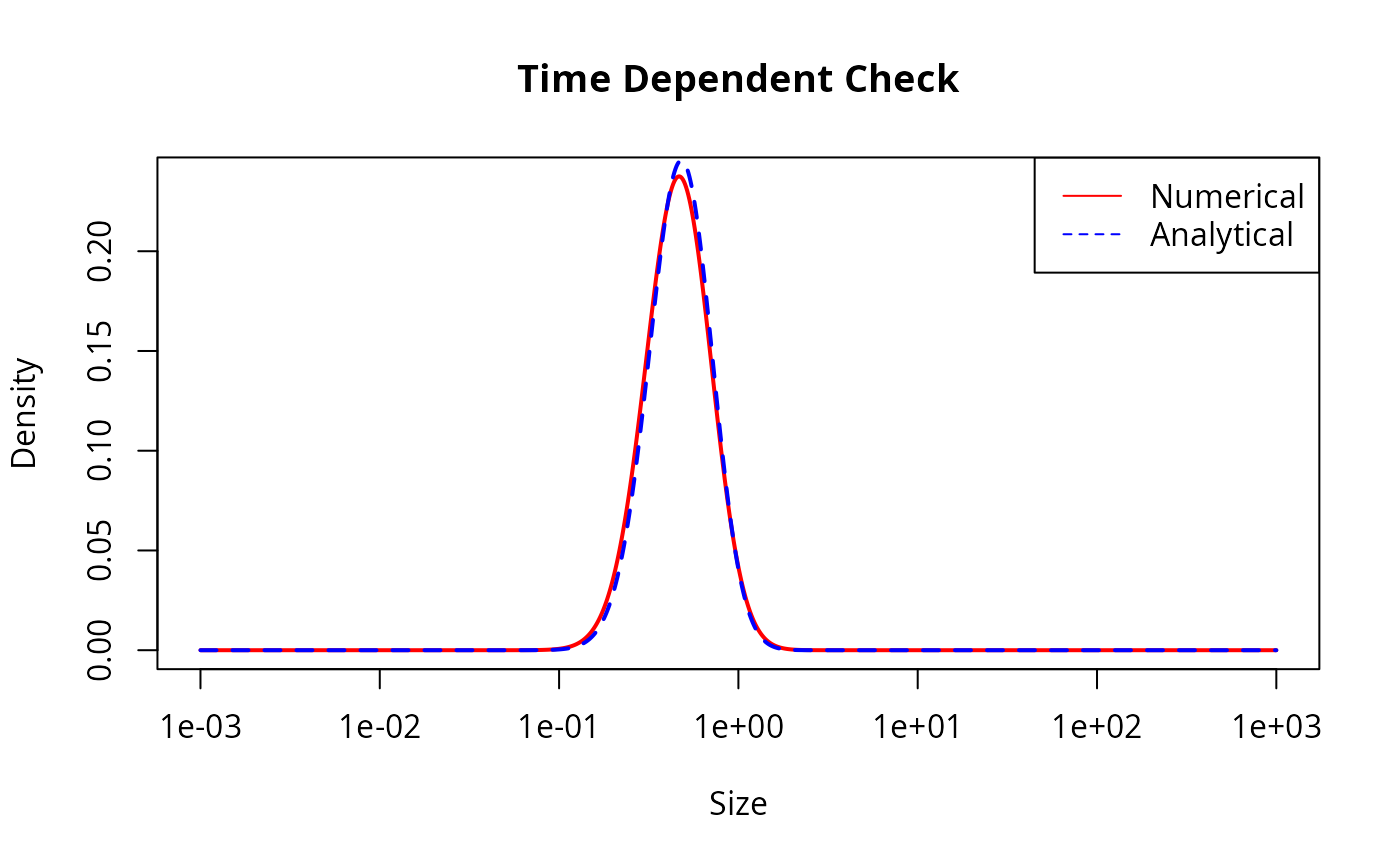
This looks good but let us also look at the agreement quantitatively:
# Robust comparison metrics
# 1. Total Abundance (Conservation)
total_n_num <- sum(final_n_num * params@dw)
total_n_ana <- sum(final_n_ana * params@dw)
rel_err_total <- abs(total_n_num - total_n_ana) / total_n_ana

# 2. Peak Location
peak_idx_num <- which.max(final_n_num)
peak_idx_ana <- which.max(final_n_ana)
peak_w_num <- w(params)[peak_idx_num]
peak_w_ana <- w(params)[peak_idx_ana]
rel_err_peak_loc <- abs(peak_w_num - peak_w_ana) / peak_w_ana

# 3. Peak Height
peak_val_num <- max(final_n_num)
peak_val_ana <- max(final_n_ana)
rel_err_peak_val <- abs(peak_val_num - peak_val_ana) / peak_val_ana

print(paste("Total Abundance Error:", rel_err_total))
#> [1] "Total Abundance Error: 0.00480520170128005"
print(paste("Peak Location Error:", rel_err_peak_loc))
#> [1] "Peak Location Error: 0.0406391712906862"
print(paste("Peak Height Error:", rel_err_peak_val))
#> [1] "Peak Height Error: 0.0323776398076434"

# Pass conditions:
#   < 0.5% abundance error,
#   < 5% location shift,
#   < 4% height difference (diffusive flattening)
if (rel_err_total < 0.005 &&
    rel_err_peak_loc < 0.05 &&
    rel_err_peak_val < 0.04) {
  print("Time-dependent test passed.")
} else {
  print("Time-dependent test failed.")
}
#> [1] "Time-dependent test passed."
Numerical diffusion
In the Euler method
The Euler method uses a first-order upwind treatment of the advective growth term. This introduces numerical diffusion. For locally constant growth rate and grid spacing, the expected numerical diffusion is \[ D_\mathrm{num} \approx g(w) \Delta w + g(w)^2 \Delta t. \]
On the logarithmic mizer grid we have approximately \(\Delta w = (\beta_\mathrm{grid} - 1)w\). To keep the analytical solution in the same power-law family, we use the special case \(p = 1\). Then \(g(w) = A w\) and both numerical diffusion terms scale like \(w^2\): \[ D_\mathrm{num}(w) \approx \left(A(\beta_\mathrm{grid} - 1) + A^2 \Delta t\right)w^2. \] So the Euler method with physical diffusion \(K w^2\) should behave like the continuous equation with \[ K_\mathrm{eff} = K + A(\beta_\mathrm{grid} - 1) + A^2 \Delta t. \]
For \(p = 1\) the transformed variable is \(x = \log w\). The density \(\tilde N(x, t) = w N(w, t)\) satisfies an advection-diffusion equation with constant diffusion and constant mortality. The Green’s function is therefore a lognormal density: \[ N(w,t) = \frac{\exp[-B(t-t_0)]}{w} \phi\left(\log w;\, \log w_0 + \left(A - \frac{K_\mathrm{eff}}{2}\right)(t-t_0), K_\mathrm{eff}(t-t_0)\right), \] where \(\phi(x; m, v)\) is the normal density with mean \(m\) and variance \(v\).
# Parameters for the Euler numerical diffusion check
p_euler <- 1
A_euler <- 1
B_euler <- 0.5
K_euler <- 0.1
dt_euler <- 0.01

N_lognormal <- function(w, t, w0, t0, K_eff) {
    dt <- t - t0
    if (dt <= 0) stop("t must be greater than t0")

    x <- log(w)
    mean_x <- log(w0) + (A_euler - 0.5 * K_eff) * dt

    exp(-B_euler * dt) *
        dnorm(x, mean = mean_x, sd = sqrt(K_eff * dt)) / w
}

start_growth_euler <- function(params, ...) {
    matrix(A_euler * params@w^p_euler, nrow = 1, byrow = TRUE)
}

start_mort_euler <- function(params, ...) {
    matrix(B_euler * params@w^(p_euler - 1), nrow = 1, byrow = TRUE)
}

params_euler <- newMultispeciesParams(sp, no_w = 1000, min_w = 1e-3,
                                      info_level = 0)
params_euler <- setRateFunction(params_euler, "EGrowth",
                                "start_growth_euler")
params_euler <- setRateFunction(params_euler, "Mort", "start_mort_euler")
ext_diffusion(params_euler)[1, ] <- K_euler * w(params_euler)^2

# The pulse stays well away from the left boundary, so no recruitment enters.
params_euler@species_params$constant_reproduction <- 0
params_euler <- setRateFunction(params_euler, "RDD", "constantRDD")

beta_grid <- w(params_euler)[2] / w(params_euler)[1]
K_num <- A_euler * (beta_grid - 1) + A_euler^2 * dt_euler
K_eff <- K_euler + K_num

w0_euler <- 1e-2
t_start_euler <- 0.1
t_end_euler <- 1

initial_n_euler <- N_lognormal(w(params_euler), t_start_euler, w0_euler,
                               0, K_eff)
initialN(params_euler) <- matrix(initial_n_euler, nrow = 1, byrow = TRUE)
We project with the Euler method and compare against the exact solution with the effective diffusion coefficient.
sim_euler <- project(params_euler,
                     t_max = t_end_euler - t_start_euler,
                     dt = dt_euler,
                     t_save = t_end_euler - t_start_euler,
                     t_start = t_start_euler,
                     method = "euler",
                     progress_bar = FALSE)

final_n_euler <- finalN(sim_euler)[1, ]
final_n_euler_ana <- N_lognormal(w(params_euler), t_end_euler, w0_euler,
                                 0, K_eff)

plot(w(params_euler), final_n_euler, log = "x", type = "l", col = "red",
     lwd = 2, main = "Euler Check with Numerical Diffusion",
     xlab = "Size", ylab = "Density")
lines(w(params_euler), final_n_euler_ana, col = "blue", lty = 2, lwd = 2)
legend("topright", legend = c("Euler", "Analytical with K_eff"),
       col = c("red", "blue"), lty = c(1, 2))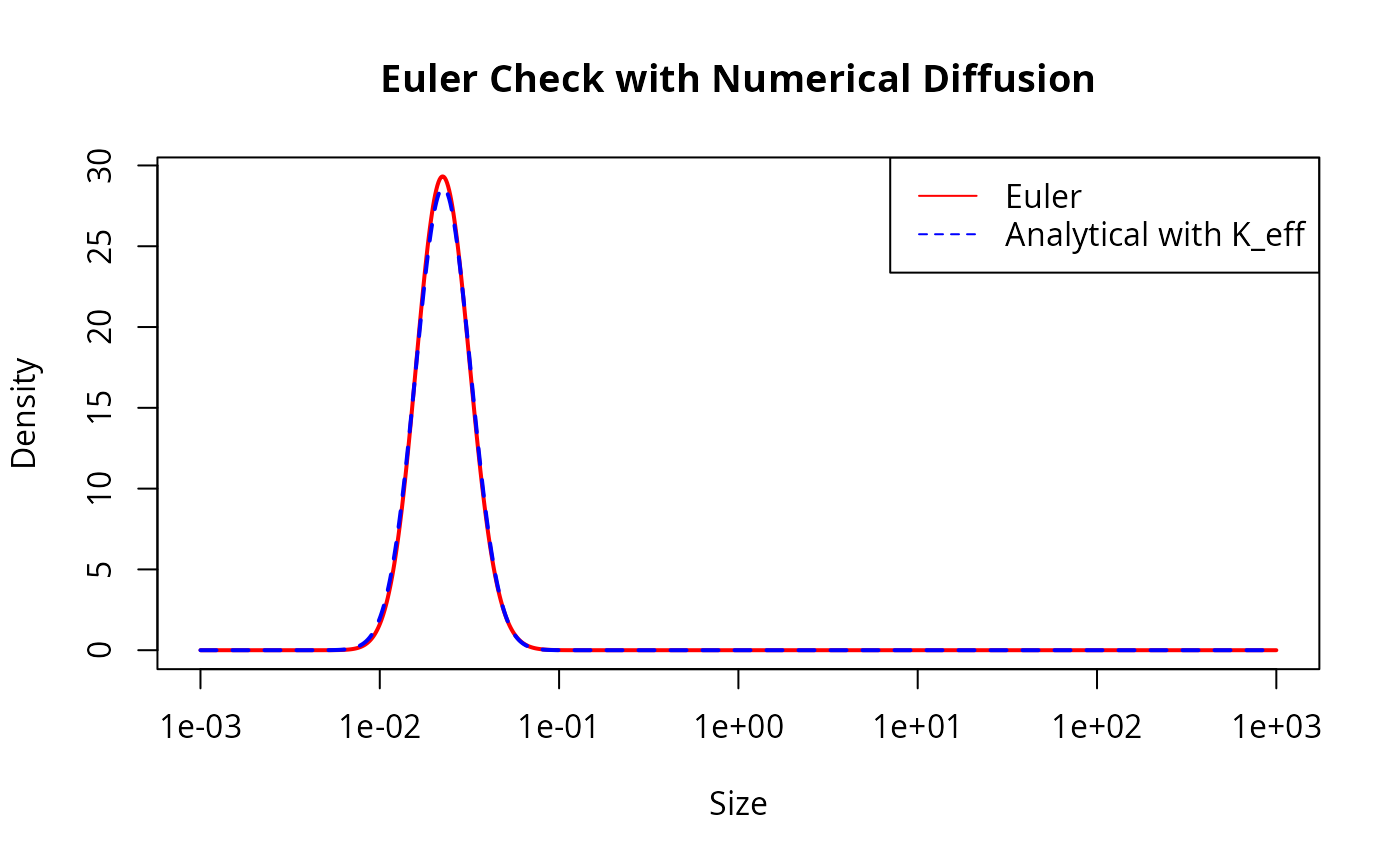
total_euler <- sum(final_n_euler * params_euler@dw)
total_euler_ana <- sum(final_n_euler_ana * params_euler@dw)
rel_err_total_euler <- abs(total_euler - total_euler_ana) / total_euler_ana

peak_idx_euler <- which.max(final_n_euler)
peak_idx_euler_ana <- which.max(final_n_euler_ana)
peak_w_euler <- w(params_euler)[peak_idx_euler]
peak_w_euler_ana <- w(params_euler)[peak_idx_euler_ana]
rel_err_peak_loc_euler <- abs(peak_w_euler - peak_w_euler_ana) /
    peak_w_euler_ana

peak_val_euler <- max(final_n_euler)
peak_val_euler_ana <- max(final_n_euler_ana)
rel_err_peak_val_euler <- abs(peak_val_euler - peak_val_euler_ana) /
    peak_val_euler_ana

print(paste("Expected numerical diffusion coefficient:", K_num))
#> [1] "Expected numerical diffusion coefficient: 0.0239254075588153"
print(paste("Effective diffusion coefficient:", K_eff))
#> [1] "Effective diffusion coefficient: 0.123925407558815"
print(paste("Total Abundance Error:", rel_err_total_euler))
#> [1] "Total Abundance Error: 0.00112189285798662"
print(paste("Peak Location Error:", rel_err_peak_loc_euler))
#> [1] "Peak Location Error: 0"
print(paste("Peak Height Error:", rel_err_peak_val_euler))
#> [1] "Peak Height Error: 0.0245757881629701"

if (rel_err_total_euler < 0.005 &&
    rel_err_peak_loc_euler < 0.005 &&
    rel_err_peak_val_euler < 0.05) {
  print("Euler numerical diffusion test passed.")
} else {
  print("Euler numerical diffusion test failed.")
}
#> [1] "Euler numerical diffusion test passed."
In the predictor-corrector method
The first-order upwind discretisation of the growth term introduces numerical diffusion even when the predictor-corrector time step is used. For this method the leading-order time discretisation diffusion is removed, so the expected additional diffusion is only the spatial contribution \[D_\mathrm{num}(w) \approx g(w) \Delta w.\] On the logarithmic mizer grid this has the same power-law form as the physical diffusion: \[ D_\mathrm{num}(w) \approx A(\beta_\mathrm{grid} - 1) w^{p+1}. \] We can therefore check whether the agreement improves if the exact solution is evaluated with \[K_\mathrm{eff} = K + A(\beta_\mathrm{grid} - 1).\]
beta_grid <- w(params)[2] / w(params)[1]
K_num_pc <- A * (beta_grid - 1)
K_eff_pc <- K + K_num_pc

final_n_ana_pc <- N_analytic(w(params), t_end, w0, 0, K_eff_pc)

total_n_ana_pc <- sum(final_n_ana_pc * params@dw)
rel_err_total_pc <- abs(total_n_num - total_n_ana_pc) / total_n_ana_pc

peak_idx_ana_pc <- which.max(final_n_ana_pc)
peak_w_ana_pc <- w(params)[peak_idx_ana_pc]
rel_err_peak_loc_pc <- abs(peak_w_num - peak_w_ana_pc) / peak_w_ana_pc

peak_val_ana_pc <- max(final_n_ana_pc)
rel_err_peak_val_pc <- abs(peak_val_num - peak_val_ana_pc) / peak_val_ana_pc

print(paste("Predictor-corrector numerical diffusion coefficient:", K_num_pc))
#> [1] "Predictor-corrector numerical diffusion coefficient: 0.0139254075588153"
print(paste("Predictor-corrector effective diffusion coefficient:", K_eff_pc))
#> [1] "Predictor-corrector effective diffusion coefficient: 0.113925407558815"
print(paste("Adjusted Total Abundance Error:", rel_err_total_pc))
#> [1] "Adjusted Total Abundance Error: 0.00066753836710786"
print(paste("Adjusted Peak Location Error:", rel_err_peak_loc_pc))
#> [1] "Adjusted Peak Location Error: 0"
print(paste("Adjusted Peak Height Error:", rel_err_peak_val_pc))
#> [1] "Adjusted Peak Height Error: 0.0226085133793947"

if (rel_err_total_pc < rel_err_total &&
    rel_err_peak_loc_pc <= rel_err_peak_loc &&
    rel_err_peak_val_pc < rel_err_peak_val) {
  print("Accounting for numerical diffusion improves the agreement.")
} else {
  print("Accounting for numerical diffusion does not improve all metrics.")
}
#> [1] "Accounting for numerical diffusion improves the agreement."

# Pass conditions:
#   < 0.5% abundance error,
#   < 5% location shift,
#   < 4% height difference (diffusive flattening)
if (rel_err_total_pc < 0.001 &&
    rel_err_peak_loc_pc < 1e-6 &&
    rel_err_peak_val_pc < 0.03) {
  print("Numerical diffusion test passed.")
} else {
  print("Numerical diffusion test failed.")
}
#> [1] "Numerical diffusion test passed."
Order of convergence in time
project() offers three time-stepping schemes (the
method argument): the first-order "euler"
scheme and the two second-order schemes
"predictor_corrector" (a Crank-Nicolson corrector) and
"tr_bdf2" (an L-stable TR-BDF2 scheme). The time-dependent
solution above lets us verify these orders directly.
We cannot read the temporal order off a comparison with the analytic solution, because that error is dominated by the spatial numerical diffusion of the first-order upwind scheme (see the previous section), which is independent of the time step and so does not vanish as \(\Delta t \to 0\). To isolate the temporal error we instead measure self-convergence: for each method we compare the solution obtained with time step \(\Delta t\) against a reference solution of the same method computed with a very small time step. The fixed spatial discretisation error cancels in this difference, leaving only the time-discretisation error, whose decay reveals the order of the scheme.
We project over a longer horizon than above, so that even the largest steps we probe take several steps, and we sweep the step size over more than two decades, from \(\Delta t = 1.6\) down to \(\Delta t = 0.025\). The travelling pulse stays well within the grid over this horizon, so the error norm, restricted to its bulk, is free of boundary effects.
elapsed <- 12.8            # length of the run (the pulse stays on the grid)
dt_ref  <- 0.025 / 8       # reference step, much finer than any tested step
dts     <- 1.6 / 2^(0:6)   # tested steps: 1.6, 0.8, ..., 0.025
methods <- c("euler", "predictor_corrector", "tr_bdf2")

wv <- w(params)
dwv <- params@dw

run_to_end <- function(method, dt) {
    sim <- project(params, t_max = elapsed, dt = dt, t_save = elapsed,
                   method = method, progress_bar = FALSE)
    finalN(sim)[1, ]
}

# Restrict the error norm to the bulk of the travelling pulse, away from the
# boundaries.
n_ana_end <- N_analytic(wv, t_start + elapsed, w0, 0)
mask <- n_ana_end > max(n_ana_end) * 1e-4
rel_L2 <- function(num, ref) {
    sqrt(sum((num[mask] - ref[mask])^2 * dwv[mask]) /
         sum(ref[mask]^2 * dwv[mask]))
}

err <- matrix(NA, length(dts), length(methods),
              dimnames = list(NULL, methods))
for (m in methods) {
    ref <- run_to_end(m, dt_ref)
    for (i in seq_along(dts)) {
        err[i, m] <- rel_L2(run_to_end(m, dts[i]), ref)
    }
}

# Fitted order over the asymptotic range (the coarsest step is outside it).
order_of <- function(m) {
    keep <- dts <= 0.1
    unname(coef(lm(log(err[keep, m]) ~ log(dts[keep])))[2])
}
ord <- sapply(methods, order_of)
print(round(ord, 2))
#>               euler predictor_corrector             tr_bdf2
#>                0.99                2.01                2.01
The fitted slopes confirm the expected behaviour:
"euler" is first order while both
"predictor_corrector" and "tr_bdf2" are second
order.
cols <- c(euler = "#E69F00", predictor_corrector = "#009E73",
          tr_bdf2 = "#0072B2")
pchs <- c(euler = 16, predictor_corrector = 17, tr_bdf2 = 15)

plot(NA, xlim = range(dts), ylim = range(err), log = "xy",
     xlab = expression(Delta * t),
     ylab = "relative L2 self-convergence error",
     main = "Temporal order of convergence")
for (m in methods) {
    lines(dts, err[, m], col = cols[m], pch = pchs[m], type = "b", lwd = 2)
}

# Slope-1 and slope-2 guide lines, anchored at the finest step.
i0 <- length(dts)
lines(dts, err[i0, "euler"]   * (dts / dts[i0])^1, lty = 3, col = "grey50")
lines(dts, err[i0, "tr_bdf2"] * (dts / dts[i0])^2, lty = 2, col = "grey50")

legend("bottomright", bty = "n",
       legend = c(sprintf("euler (order %.2f)", ord["euler"]),
                  sprintf("predictor_corrector (order %.2f)",
                          ord["predictor_corrector"]),
                  sprintf("tr_bdf2 (order %.2f)", ord["tr_bdf2"]),
                  "slope 1", "slope 2"),
       col = c(cols, "grey50", "grey50"),
       pch = c(pchs, NA, NA), lty = c(1, 1, 1, 3, 2), lwd = 2)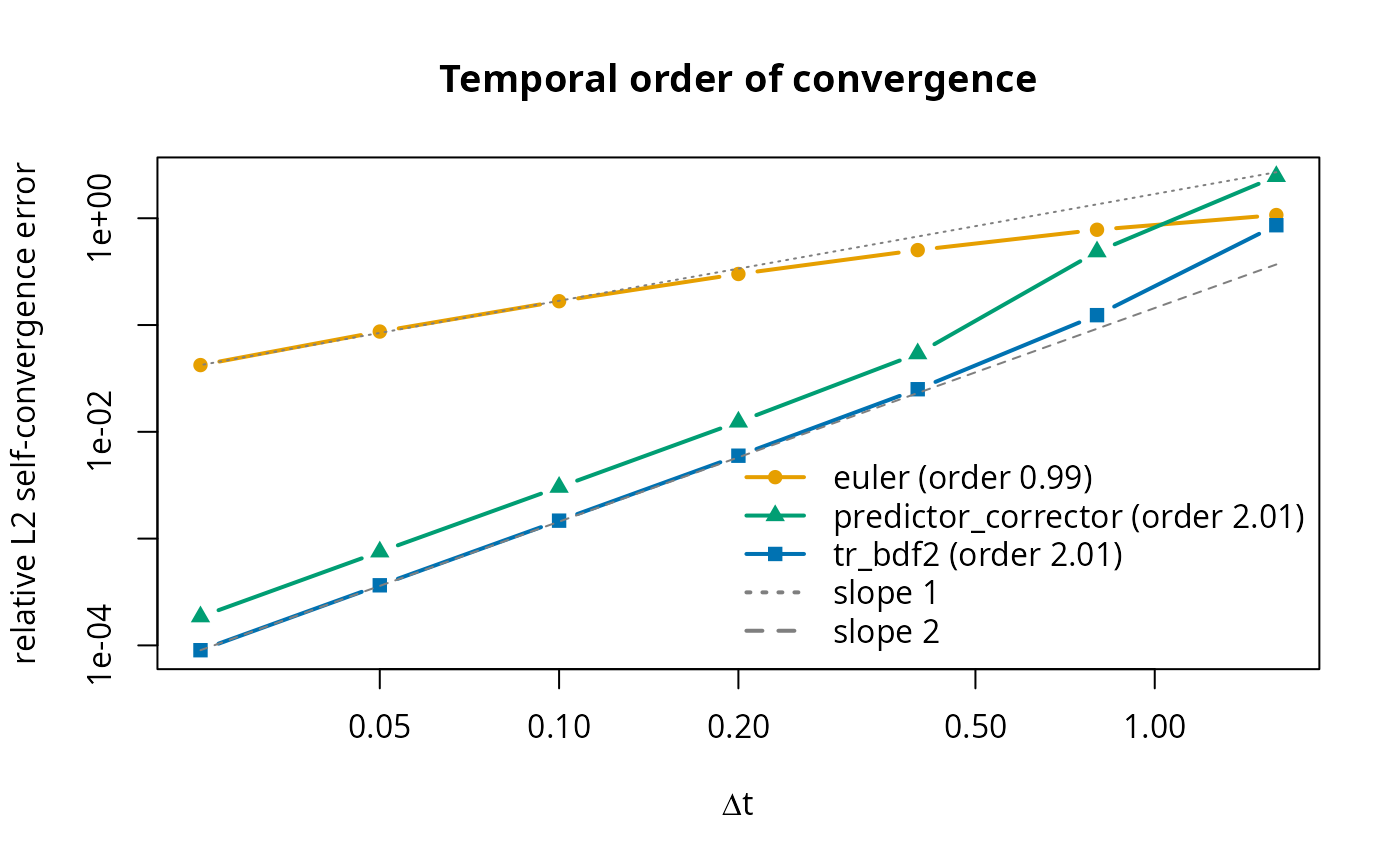
In the asymptotic range (small \(\Delta
t\)) the two second-order curves run parallel to the slope-2
guide line, four times more accurate for each halving of the time step,
whereas the "euler" curve follows the slope-1 line. At the
large steps the picture diverges sharply: the
"predictor_corrector" curve bends well above the slope-2
line and at \(\Delta t = 1.6\) its
error exceeds one, because the Crank-Nicolson corrector overshoots
(rings) for large steps. The L-stable "tr_bdf2" curve
instead stays close to the slope-2 trend and remains an order of
magnitude more accurate there. This is the large-step robustness
discussed in the Numerical details
vignette.
Order of convergence in size
The previous section isolated the error in the time step. Here we
isolate the error in the size step and verify that
second_order_w <- TRUE turns the transport step from
first to second order in the grid spacing. With the default
(FALSE) mizer uses the first-order upwind advective flux,
whose numerical diffusion scales like \(g(w)\,w\log\beta\). Setting
second_order_w <- TRUE selects the second-order
finite-volume scheme (the flux_limiter flag) and
the bin-averaged sinks (the bin_average flag); both are
needed, because the second-order fluxes would otherwise be held back by
a point-sampled mortality (see the Numerical details vignette).
One thing changes in how we measure the error. In the second-order
scheme the finite-volume cells are the bins, so \(N_j\) is the cell average
over \([w_j, w_{j+1}]\), which equals
the analytic value at the cell centre \(w_j^c=\sqrt{w_j w_{j+1}}\) to second order
— not the value at the node \(w_j\). We
therefore set the initial condition and compare against the analytic
solution sampled at the cell centres; for the first-order scheme, whose
\(N_j\) is a node value, we use the
nodes. (Using node values for the second-order field would re-introduce
an \(O(\Delta w)\) node-versus-centre
offset and mask the order.) We supply the power-law mortality through
the z_ext species parameter so that it is bin-averaged when
bin_average is on.
We refine the grid by increasing no_w and, as in the
time-dependent test above, project the analytic pulse from \(t_{start}\) to \(t_{end}\) and measure the relative \(L^2\) error against
N_analytic, restricted to the bulk of the pulse. The time
step is kept small and fixed with the second-order tr_bdf2
method so that the temporal error is negligible and the slope reflects
the spatial order alone.
build_sp <- function(no_w, second_order) {
    sp <- data.frame(species = "Test", w_max = 1000, w_mat = 100,
                     n = p, z0 = 0, z_ext = B, d = p - 1, D_ext = K)
    pr <- newMultispeciesParams(sp, no_w = no_w, min_w = 1e-3, info_level = 0)
    second_order_w(pr) <- second_order
    pr <- setRateFunction(pr, "EGrowth", "start_growth")
    pr@interaction[] <- 0           # no predation: total mortality is B w^(p-1)
    pr <- setExtMort(pr)
    pr@species_params$constant_reproduction <- 0
    setRateFunction(pr, "RDD", "constantRDD")
}

# Cell average (= cell-centre value) for the second-order scheme, node value for
# the first-order scheme.
ref_w <- function(pr, second_order) {
    wv <- w(pr)
    if (second_order) wv * sqrt(wv[2] / wv[1]) else wv
}

pulse_err <- function(no_w, second_order, dt = 0.0025) {
    pr <- build_sp(no_w, second_order)
    rw <- ref_w(pr, second_order)
    initialN(pr) <- matrix(N_analytic(rw, t_start, w0, 0), nrow = 1)
    sim <- project(pr, t_max = t_end - t_start, dt = dt,
                   t_save = t_end - t_start, method = "tr_bdf2",
                   progress_bar = FALSE)
    num <- finalN(sim)[1, ]
    ana <- N_analytic(rw, t_end, w0, 0)
    mask <- ana > max(ana) * 1e-3        # bulk of the pulse, away from boundaries
    sqrt(sum((num[mask] - ana[mask])^2 * pr@dw[mask]) /
         sum(ana[mask]^2 * pr@dw[mask]))
}

no_ws <- c(50, 100, 200, 400, 800)
dx <- log(1000 / 1e-3) / no_ws            # log-size grid spacing
err_first  <- sapply(no_ws, pulse_err, second_order = FALSE)
err_second <- sapply(no_ws, pulse_err, second_order = TRUE)

sp_order <- function(e) unname(coef(lm(log(e) ~ log(dx)))[2])
round(c(first_order = sp_order(err_first),
        second_order = sp_order(err_second)), 2)
#>  first_order second_order
#>         0.74         2.04
The fitted slopes confirm that the default scheme is first order in
the size step while second_order_w <- TRUE is, indeed,
second order.
plot(dx, err_first, log = "xy", type = "b", pch = 16, lwd = 2,
     col = "#E69F00", xlab = expression(Delta * x == log * beta),
     ylab = "relative L2 error", ylim = range(err_first, err_second),
     main = "Spatial order of convergence")
lines(dx, err_second, type = "b", pch = 17, lwd = 2, col = "#0072B2")

# slope-1 and slope-2 guide lines, anchored at the finest grid
i0 <- length(dx)
lines(dx, err_first[i0]  * (dx / dx[i0])^1, lty = 3, col = "grey50")
lines(dx, err_second[i0] * (dx / dx[i0])^2, lty = 2, col = "grey50")

legend("bottomright", bty = "n",
       legend = c(sprintf("first order (%.2f)", sp_order(err_first)),
                  sprintf("second order (%.2f)", sp_order(err_second)),
                  "slope 1", "slope 2"),
       col = c("#E69F00", "#0072B2", "grey50", "grey50"),
       pch = c(16, 17, NA, NA), lty = c(1, 1, 3, 2), lwd = 2)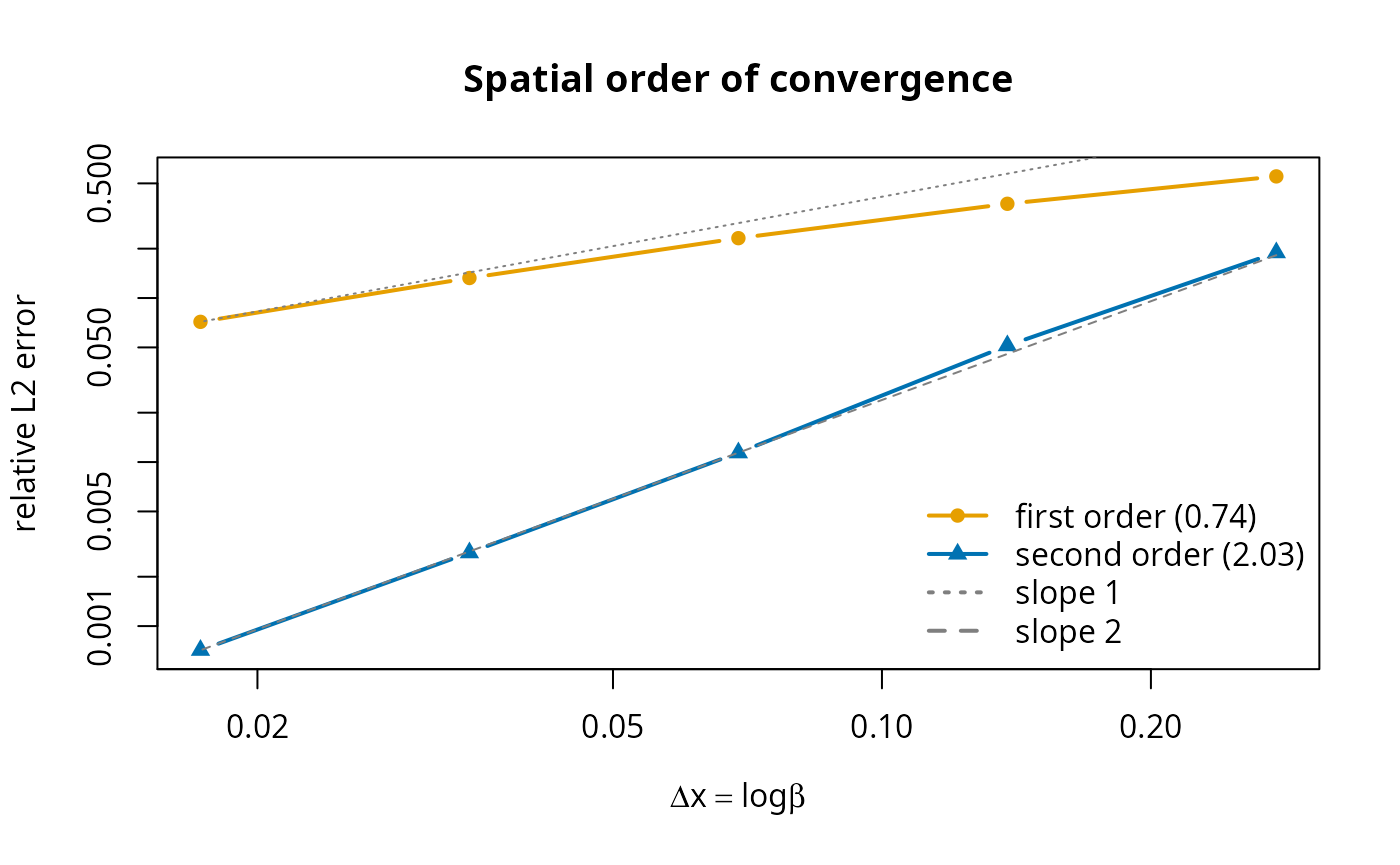
The first-order curve runs parallel to the slope-1 guide line —
halving the grid spacing only halves the error — while the second-order
curve follows the slope-2 line, four times more accurate for each
halving of \(\Delta x\), and is already
an order of magnitude more accurate at these resolutions. (The
travelling pulse has a peak, where the van Leer limiter falls back to
first order; over the resolutions shown that single-cell contribution
stays below the smooth \(O(\Delta
x^2)\) error of the bulk. The "centred"
reconstruction, which keeps second order even at the peak, gives an
almost identical slope here.)
For the steady-state power law we set each model up at the steady state of its own discretisation with [steadySingleSpecies()] and compare to the exact power law sampled at the same reference sizes.
steady_err <- function(no_w, second_order) {
    pr <- build_sp(no_w, second_order)
    rw <- ref_w(pr, second_order)
    initialN(pr) <- matrix(rw^(-lambda), nrow = 1)
    pr@species_params$constant_reproduction <- getRequiredRDD(pr)
    pr <- setRateFunction(pr, "RDD", "constantRDD")
    pr <- steadySingleSpecies(pr, keep = "egg")
    num <- initialN(pr)[1, ]
    ana <- rw^(-lambda)
    no <- length(num)
    mask <- seq_len(no) > 0.05 * no & seq_len(no) < 0.85 * no
    sqrt(sum((num[mask] - ana[mask])^2 * pr@dw[mask]) /
         sum(ana[mask]^2 * pr@dw[mask]))
}

err_ss_first  <- sapply(no_ws, steady_err, second_order = FALSE)
err_ss_second <- sapply(no_ws, steady_err, second_order = TRUE)
round(c(first_order = sp_order(err_ss_first),
        second_order = sp_order(err_ss_second)), 2)
#>  first_order second_order
#>         0.95         1.35
Again the first-order steady state converges at first order and the second-order scheme faster; the second-order slope approaches 2 as the grid is refined, the small shortfall coming from the first-order upwind treatment that both schemes keep at the non-smooth recruitment boundary, which the steady state feels through the reproduction influx there.