Add lines to an existing plot
Source:R/ArraySpeciesBySize-class.R, R/ArrayTimeBySpecies-class.R
addPlot.Rd![[Experimental]](figures/lifecycle-experimental.svg)
addPlot() adds another set of values to an existing ggplot. The first
method supports adding an ArraySpeciesBySize object to a compatible plot,
for example to compare the same rate before and after a model change.
The method checks whether the existing plot uses a compatible x variable,
and warns if the y variable or y-axis units appear to differ.
Usage
addPlot(
  plot,
  x,
  species = NULL,
  total = FALSE,
  background = TRUE,
  colour = NULL,
  linetype = "dashed",
  linewidth = 0.8,
  alpha = 1,
  ...
)
Arguments
- plot
A ggplot2 object to which the new values should be added.
- x
An object containing the values to add.
- species
Character vector of species to include.
NULL(default) means all species.- total
A boolean value that determines whether the total over all selected species is plotted as well. Default is
FALSE.- background
A boolean value that determines whether background species are included. Ignored if the model does not contain background species. Default is
TRUE.- colour
Optional fixed colour for the added lines. If
NULL, the species colours from the existing plot are used.- linetype
Optional fixed line type for the added lines. If
NULL, the species line types from the existing plot are used.- linewidth
Width of the added lines.
- alpha
Transparency of the added lines.
- ...
Further arguments used by only some of the methods:
For
ArraySpeciesBySizemethods:all.sizesIf
FALSE(default), values outside a species' size range (w_mintow_max) are removed.wlimA numeric vector of length two providing lower and upper limits for the weight (x) axis. Use
NAto refer to the existing minimum or maximum.llimA numeric vector of length two providing lower and upper limits for the length (x) axis when
size_axis = "l". UseNAto refer to the existing minimum or maximum.size_axisWhether to plot size as weight (
"w", default) or length ("l"), using the allometric weight-length relationship.
For
ArrayTimeBySpeciesmethods:tlimA numeric vector of length two providing lower and upper limits for the time axis, e.g.
c(1980, 2000). UseNAto apply no limit at that end. Default isc(NA, NA).ylimA numeric vector of length two providing lower and upper limits for the value (y) axis.
See also
Other plotting functions:
animate(),
plot,
plot2(),
plotBiomass(),
plotCDF(),
plotCDF2(),
plotDiet(),
plotFMort(),
plotFeedingLevel(),
plotGrowthCurves(),
plotMizerParams,
plotMizerSim,
plotPredMort(),
plotRelative(),
plotSpectra(),
plotSpectra2(),
plotSpectraRelative(),
plotYield(),
plotYieldGear(),
plotting_functions
Examples
# \donttest{
p <- plot(getEncounter(NS_params), species = "Cod")
addPlot(p, getEncounter(NS_params), species = "Cod")
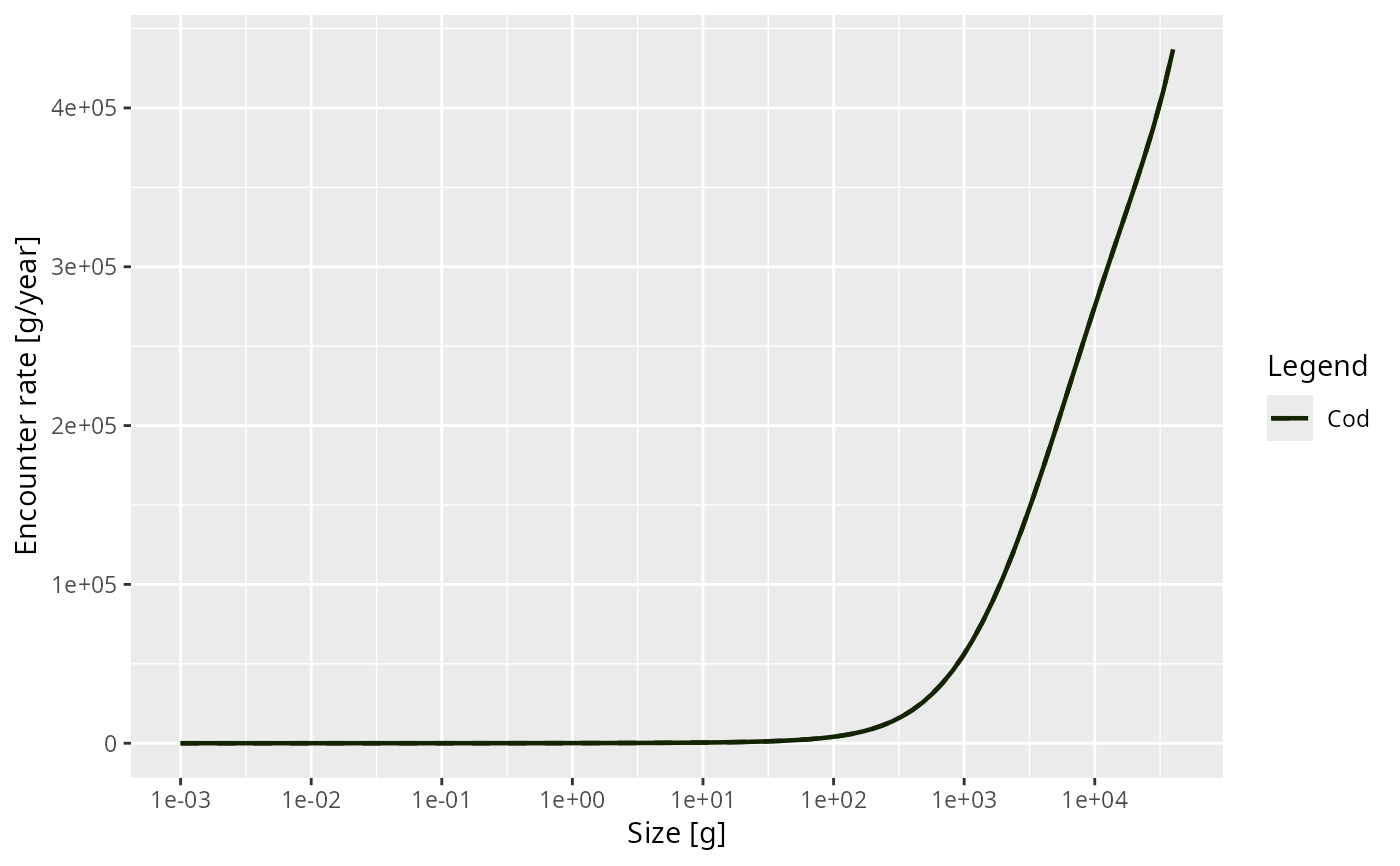 # }
# }