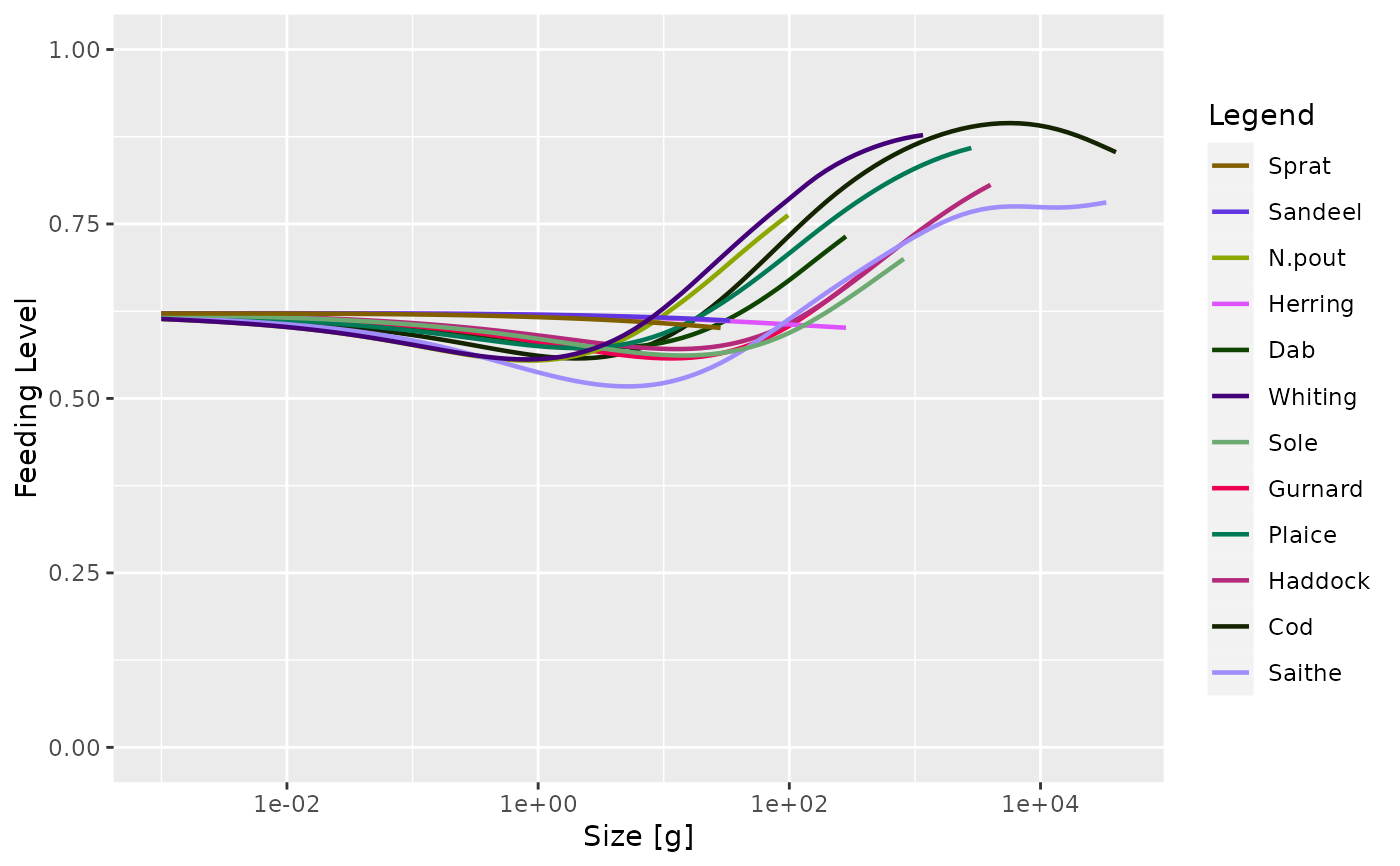
After running a projection, plot the feeding level of each species by size. The feeding level is averaged over the specified time range (a single value for the time range can be used).
Arguments
- object
An object of class MizerSim or MizerParams.
- species
The species to be selected. Optional. By default all target species are selected. A vector of species names, or a numeric vector with the species indices, or a logical vector indicating for each species whether it is to be selected (TRUE) or not.
- all.sizes
If TRUE, then feeding level is plotted also for sizes outside a species' size range. Default FALSE.
- highlight
Name or vector of names of the species to be highlighted.
- include_critical
If TRUE, then the critical feeding level is also plotted. Default FALSE.
- wlim
A numeric vector of length two providing lower and upper limits for the weight (x) axis. Use
NAto auto-scale to the data range.- llim
A numeric vector of length two providing lower and upper limits for the length (x) axis when
size_axis = "l". UseNAto auto-scale to the data range.- size_axis
Whether to plot size as weight (
"w", default) or length ("l"), using the allometric weight-length relationship.- return_data
A boolean value that determines whether the formatted data used for the plot is returned instead of the plot itself. Default is FALSE.
- log_x
If
TRUE(default), use a log10 x-axis.- log_y
If
TRUE, use a log10 y-axis. Default isFALSE.- log
Character string specifying which axes should use log10 scales, in the same form as the base
plot()argument. For example,"x","y","xy"or"". If supplied, this overrideslog_xandlog_y.- ...
Further arguments used by only some of the methods:
For
MizerSimmethods:time_rangeThe time range (either a vector of values, a vector of min and max time, or a single value) to average the feeding level over. Default is the final time step.
Value
A ggplot2 object, unless return_data = TRUE, in which case a data
frame with the variables 'w' (or 'l' if size_axis = "l"), 'value' and
'Species' is returned. If also include_critical = TRUE then the data
frame contains a fourth variable 'Type' that distinguishes between
'actual' and 'critical' feeding level.
Details
When called with a MizerSim object, the feeding level is averaged over the specified time range (a single value for the time range can be used to plot a single time step). When called with a MizerParams object the initial feeding level is plotted.
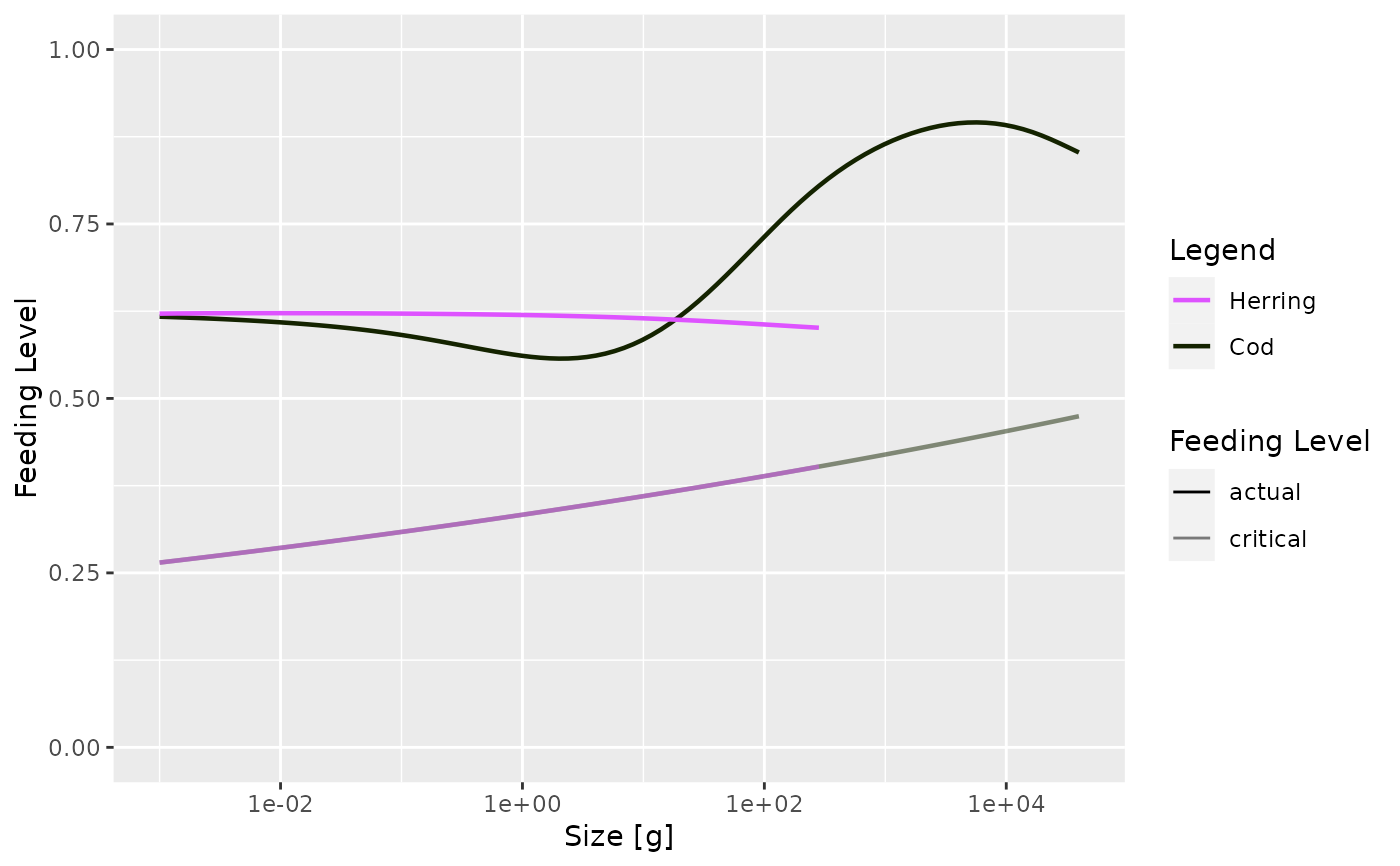
If include_critical = TRUE then the critical feeding level (the feeding
level at which the intake just covers the metabolic cost) is also plotted,
with a thinner line. This line should always stay below the line of the
actual feeding level, because the species would stop growing at any point
where the feeding level drops to the critical feeding level.
See also
plotting_functions, getFeedingLevel()
Other plotting functions:
addPlot(),
animate.ArrayTimeBySpeciesBySize(),
plot,
plot2(),
plotBiomass(),
plotCDF(),
plotCDF2(),
plotDiet(),
plotFMort(),
plotGrowthCurves(),
plotMizerParams,
plotMizerSim,
plotPredMort(),
plotRelative(),
plotSpectra(),
plotSpectra2(),
plotSpectraRelative(),
plotYield(),
plotYieldGear(),
plotting_functions
Examples
# \donttest{
params <- NS_params
sim <- project(params, effort=1, t_max=20, t_save = 2, progress_bar = FALSE)
plotFeedingLevel(sim)
 plotFeedingLevel(sim, time_range = 10:20, species = c("Cod", "Herring"),
include_critical = TRUE)
plotFeedingLevel(sim, time_range = 10:20, species = c("Cod", "Herring"),
include_critical = TRUE)
 # Returning the data frame
fr <- plotFeedingLevel(sim, return_data = TRUE)
str(fr)
#> 'data.frame': 934 obs. of 3 variables:
#> $ w : num 0.001 0.001 0.001 0.001 0.001 0.001 0.001 0.001 0.001 0.001 ...
#> $ Feeding level: num 0.622 0.622 0.614 0.621 0.619 ...
#> $ Species : chr "Sprat" "Sandeel" "N.pout" "Herring" ...
# }
# Returning the data frame
fr <- plotFeedingLevel(sim, return_data = TRUE)
str(fr)
#> 'data.frame': 934 obs. of 3 variables:
#> $ w : num 0.001 0.001 0.001 0.001 0.001 0.001 0.001 0.001 0.001 0.001 ...
#> $ Feeding level: num 0.622 0.622 0.614 0.621 0.619 ...
#> $ Species : chr "Sprat" "Sandeel" "N.pout" "Herring" ...
# }