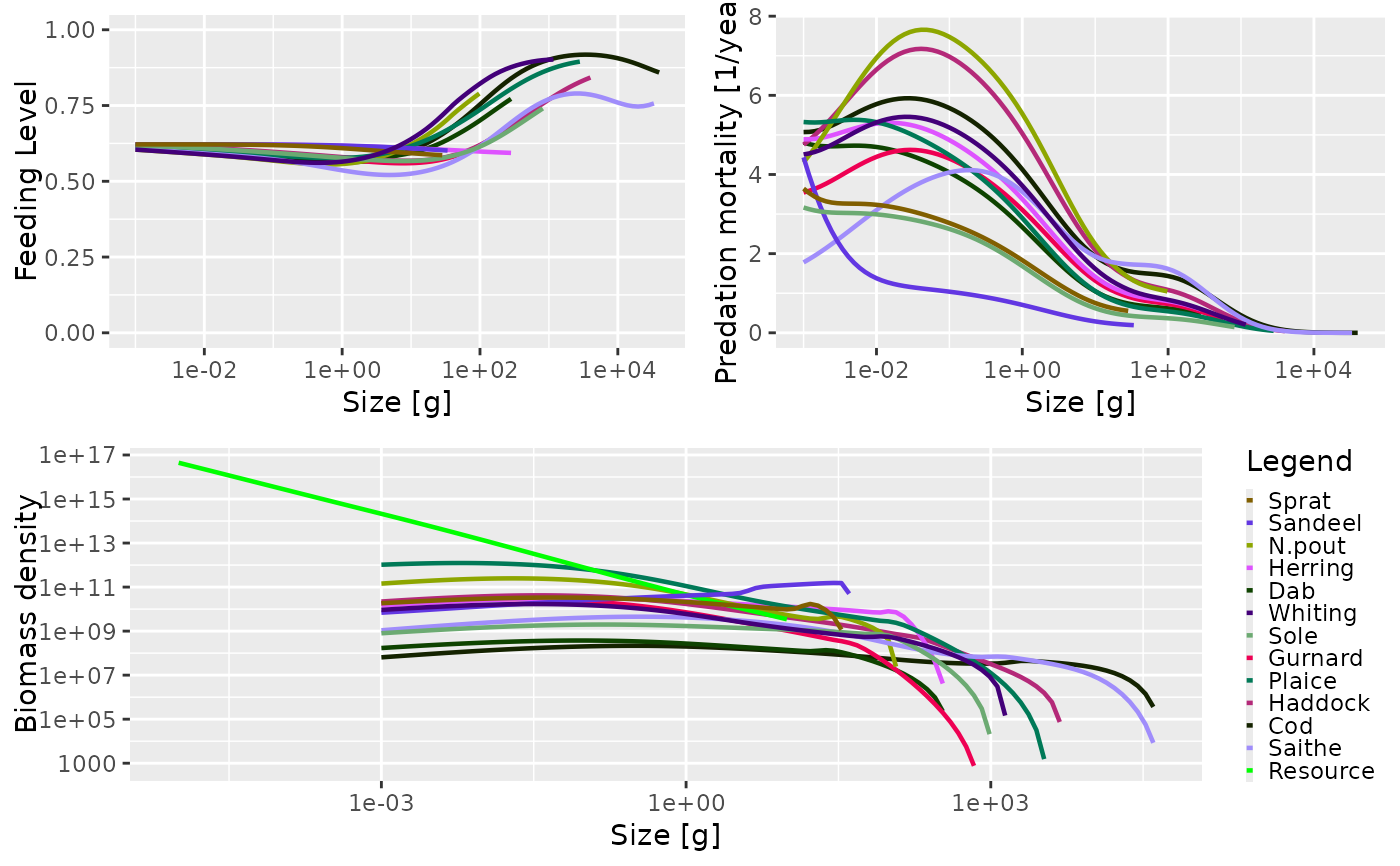
Produces 3 plots in the same window: abundance spectra, feeding level and predation mortality of each species through time. This method just uses the other plotting functions and puts them all in one window.
Usage
# S4 method for class 'MizerParams,missing'
plot(x, y, ...)
Arguments
- x
An object of class MizerParams
- y
Not used
- ...
For additional arguments see the documentation for
plotFeedingLevel(),plotSpectra(),plotPredMort()
Examples
# \donttest{
params <-  NS_params
plot(params)

# }
# }