![[Experimental]](figures/lifecycle-experimental.svg) Plots the proportions with which each
prey species contributes to the total biomass consumed by the specified
predator species, as a function of the predator's size. These proportions are
obtained with
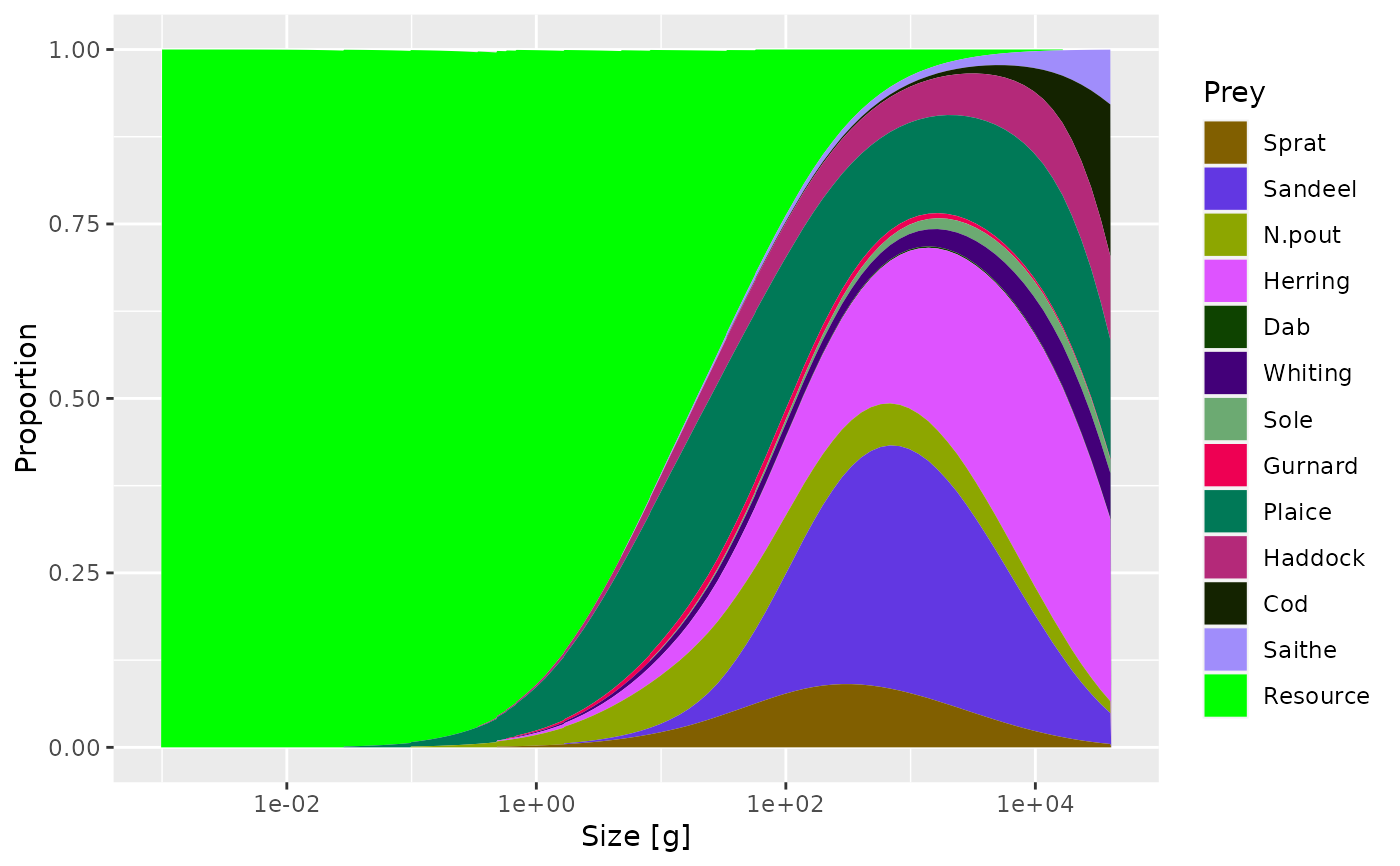
Plots the proportions with which each
prey species contributes to the total biomass consumed by the specified
predator species, as a function of the predator's size. These proportions are
obtained with getDiet().
Arguments
- object
An object of class MizerSim or MizerParams.
- species
The species to be selected. Optional. By default all target species are selected. A vector of species names, or a numeric vector with the species indices, or a logical vector indicating for each species whether it is to be selected (TRUE) or not.
- wlim
A numeric vector of length two providing lower and upper limits for the weight (x) axis. Use
NAto auto-scale to the data range.- llim
A numeric vector of length two providing lower and upper limits for the length (x) axis when
size_axis = "l". UseNAto auto-scale to the data range.- size_axis
Whether to plot size as weight (
"w", default) or length ("l"), using the allometric weight-length relationship.- return_data
A boolean value that determines whether the formatted data used for the plot is returned instead of the plot itself. Default is FALSE.
- log_x
If
TRUE(default), use a log10 x-axis.- log_y
If
TRUE, use a log10 y-axis. Default isFALSE.- log
Character string specifying which axes should use log10 scales, in the same form as the base
plot()argument. For example,"x","y","xy"or"". If supplied, this overrideslog_xandlog_y.- ...
Further arguments used by only some of the methods:
For
MizerSimmethods:time_range: The time range (either a vector of values, a vector of min and max time, or a single value) over which to average the diet. The consumption rates are averaged over this range and then normalised to proportions. Default is the final time step.
Value
A ggplot2 object, unless return_data = TRUE, in which case a data
frame with the four variables 'Predator', 'w' (or 'l' if
size_axis = "l"), 'Proportion', 'Prey' is returned.
plotlyDiet() returns a plotly object.
Details
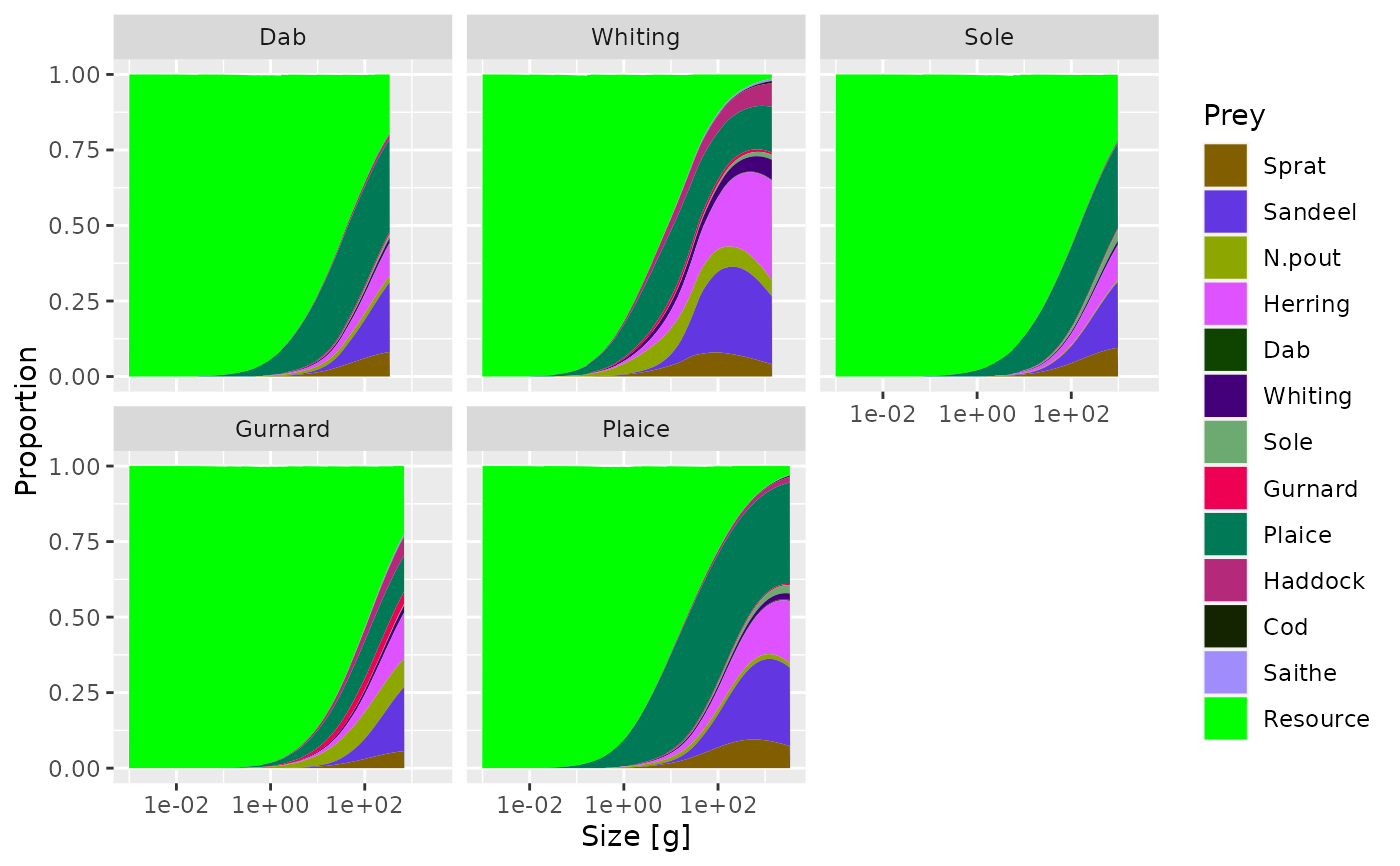
Prey species that contribute less than 1 permille to the diet are suppressed in the plot. The plot only extends to predator sizes where the predator has a meaningful abundance (defined as having a biomass density greater than 0.1% of its maximum biomass density).
If more than one predator species is selected, then the plot contains one facet for each species.
See also
Other plotting functions:
addPlot(),
animate.ArrayTimeBySpeciesBySize(),
plot,
plot2(),
plotBiomass(),
plotCDF(),
plotCDF2(),
plotFMort(),
plotFeedingLevel(),
plotGrowthCurves(),
plotMizerParams,
plotMizerSim,
plotPredMort(),
plotRelative(),
plotSpectra(),
plotSpectra2(),
plotSpectraRelative(),
plotYield(),
plotYieldGear(),
plotting_functions
Examples
# \donttest{
plotDiet(NS_params, species = "Cod")

plotDiet(NS_params, species = 5:9)


# Returning the data frame
fr <- plotDiet(NS_params, species = "Cod", return_data = TRUE)
str(fr)
#> 'data.frame':	800 obs. of  4 variables:
#>  $ Predator  : Factor w/ 1 level "Cod": 1 1 1 1 1 1 1 1 1 1 ...
#>  $ w         : num  0.486 0.58 0.693 0.827 0.987 1.18 1.4 1.68 2 2.39 ...
#>  $ Prey      : Factor w/ 14 levels "External","Resource",..: 14 14 14 14 14 14 14 14 14 14 ...
#>  $ Proportion: num  0.00113 0.00139 0.0017 0.00208 0.00254 ...
# }
# Returning the data frame
fr <- plotDiet(NS_params, species = "Cod", return_data = TRUE)
str(fr)
#> 'data.frame': 800 obs. of 4 variables:
#> $ Predator : Factor w/ 1 level "Cod": 1 1 1 1 1 1 1 1 1 1 ...
#> $ w : num 0.486 0.58 0.693 0.827 0.987 1.18 1.4 1.68 2 2.39 ...
#> $ Prey : Factor w/ 14 levels "External","Resource",..: 14 14 14 14 14 14 14 14 14 14 ...
#> $ Proportion: num 0.00113 0.00139 0.0017 0.00208 0.00254 ...
# }