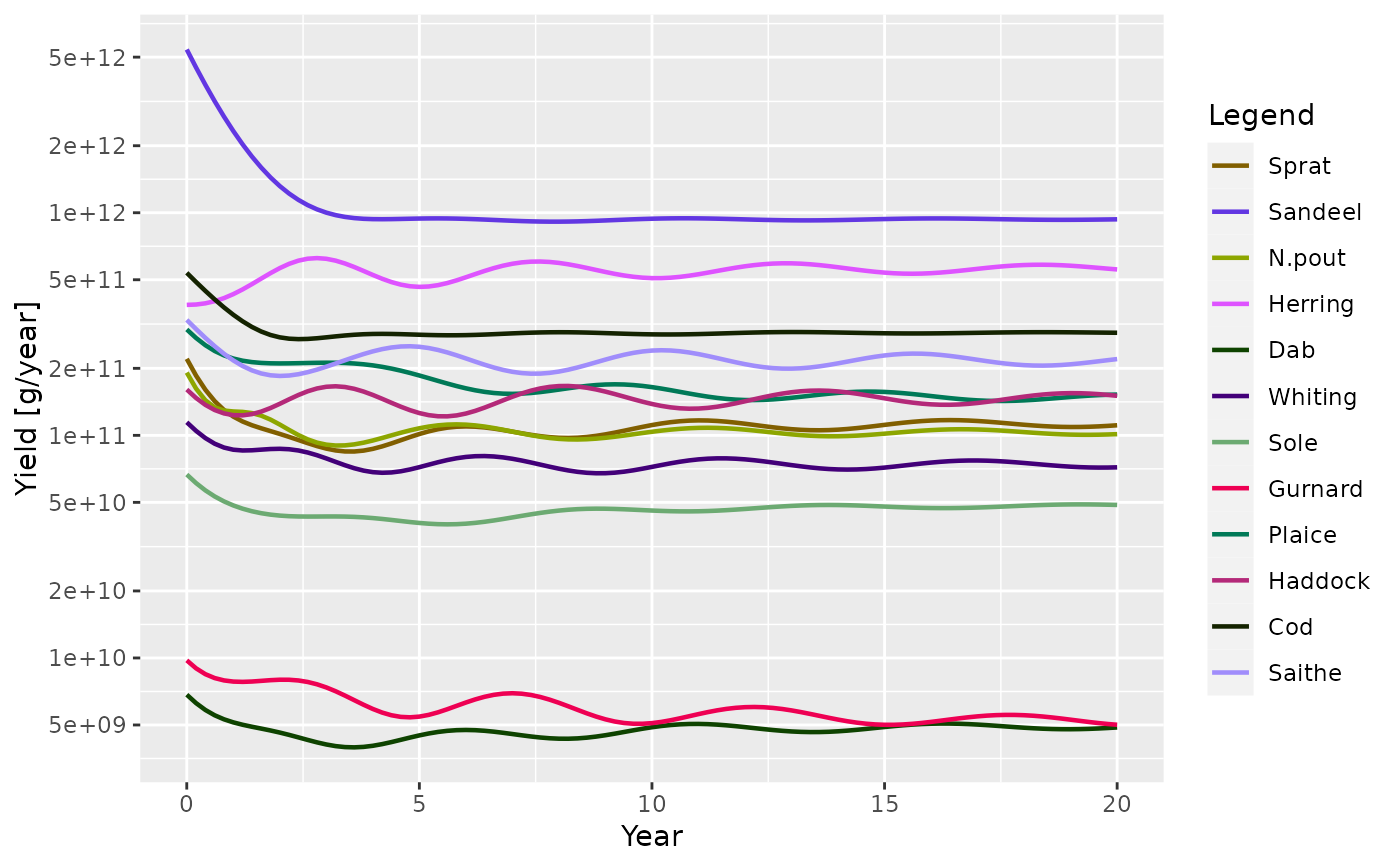
After running a projection, the total yield of each species across all
fishing gears can be plotted against time. The yield is obtained with
getYield().
Arguments
- object
An object of class MizerSim
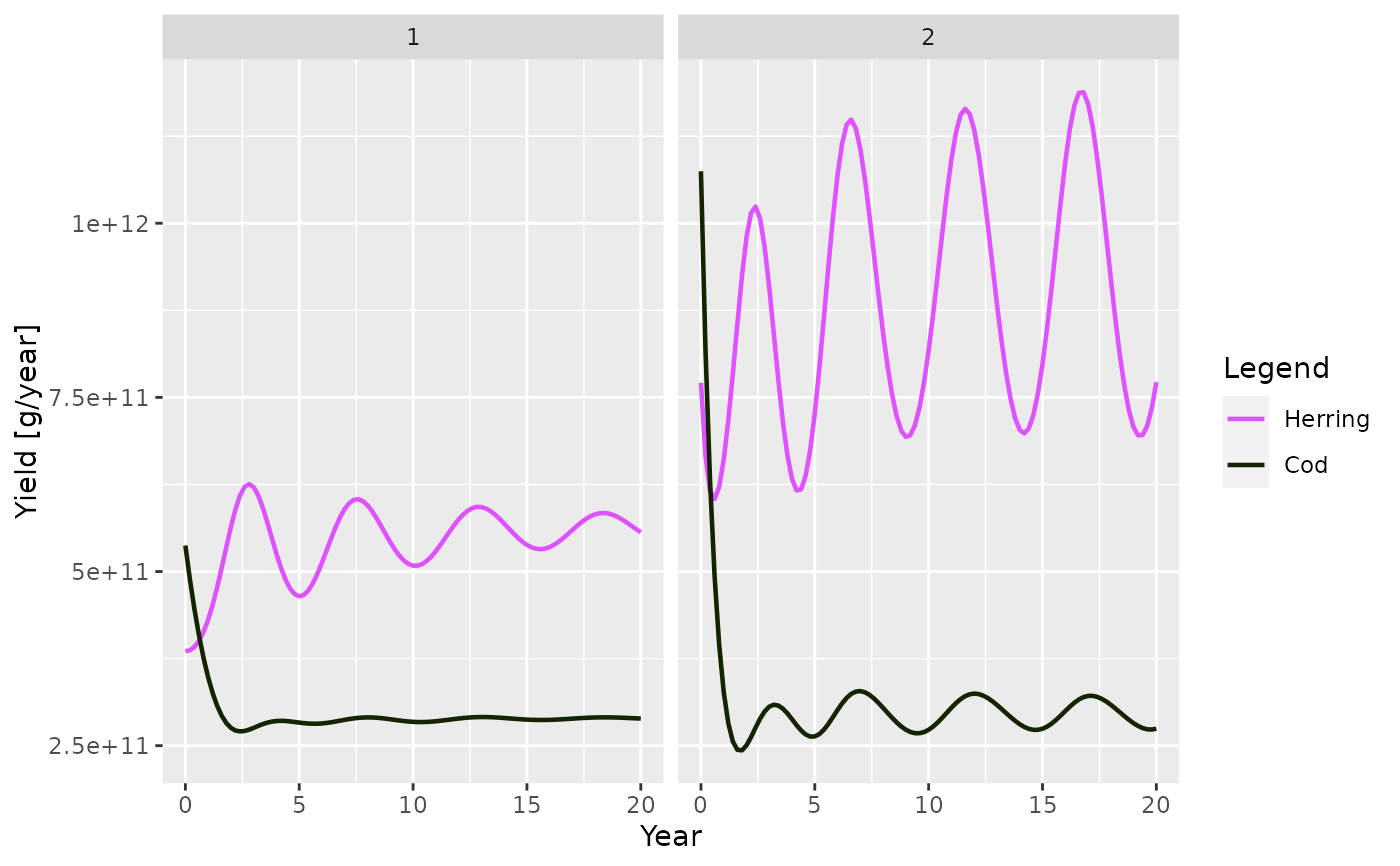
- sim2
An optional second object of class MizerSim. If this is provided its yields will be shown on the same plot in bolder lines.
- species
The species to be selected. Optional. By default all target species are selected. A vector of species names, or a numeric vector with the species indices, or a logical vector indicating for each species whether it is to be selected (TRUE) or not.
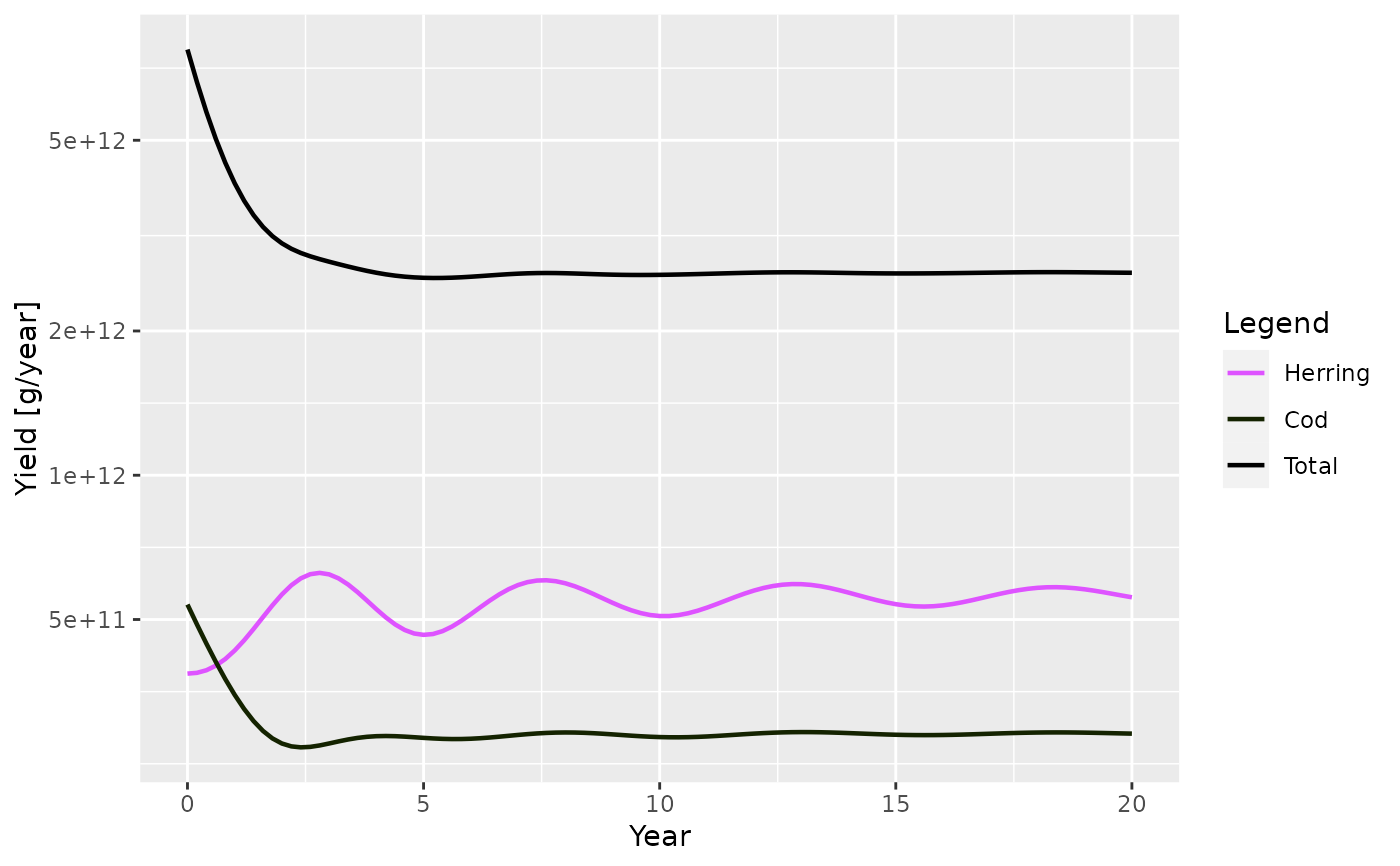
- total
A boolean value that determines whether the total yield from all species is plotted as well. Default is FALSE.
- log_x
If
TRUE, use a log10 x-axis. Default isFALSE.- log_y
If
TRUE, use a log10 y-axis. Default isTRUE.- log
Character string specifying which axes should use log10 scales, in the same form as the base
plot()argument. For example,"x","y","xy"or"". If supplied, this overrideslog_xandlog_y. For backward compatibility,TRUEandFALSEare interpreted as setting onlylog_y.- ylim
A numeric vector of length two providing lower and upper limits for the y axis. Use
NAto refer to the existing minimum or maximum.- tlim
A numeric vector of length two providing lower and upper limits for the time axis, e.g.
c(1980, 2000). UseNAto apply no limit at that end. Default isc(NA, NA).- highlight
Name or vector of names of the species to be highlighted.
- return_data
A boolean value that determines whether the formatted data used for the plot is returned instead of the plot itself. Default is FALSE.
- ...
Arguments passed to
getYield().
Value
A ggplot2 object, unless return_data = TRUE, in which case a data
frame with the three variables 'Year', 'Yield', 'Species' is returned.
See also
plotting_functions, getYield()
Other plotting functions:
addPlot(),
animate.ArrayTimeBySpeciesBySize(),
plot,
plot2(),
plotBiomass(),
plotCDF(),
plotCDF2(),
plotDiet(),
plotFMort(),
plotFeedingLevel(),
plotGrowthCurves(),
plotMizerParams,
plotMizerSim,
plotPredMort(),
plotRelative(),
plotSpectra(),
plotSpectra2(),
plotSpectraRelative(),
plotYieldGear(),
plotting_functions
Examples
# \donttest{
params <- NS_params
sim <- project(params, effort = 1, t_max = 20, t_save = 0.2, progress_bar = FALSE)
plotYield(sim)
 plotYield(sim, species = c("Cod", "Herring"), total = TRUE)
 # Comparing with yield from twice the effort
sim2 <- project(params, effort=2, t_max=20, t_save = 0.2, progress_bar = FALSE)
plotYield(sim, sim2, species = c("Cod", "Herring"), log = FALSE)
# Comparing with yield from twice the effort
sim2 <- project(params, effort=2, t_max=20, t_save = 0.2, progress_bar = FALSE)
plotYield(sim, sim2, species = c("Cod", "Herring"), log = FALSE)
 # Returning the data frame
fr <- plotYield(sim, return_data = TRUE)
str(fr)
#> 'data.frame': 1212 obs. of 3 variables:
#> $ Year : num 0 0.2 0.4 0.6 0.8 1 1.2 1.4 1.6 1.8 ...
#> $ Yield : num 2.21e+11 1.86e+11 1.60e+11 1.42e+11 1.30e+11 ...
#> $ Species: Factor w/ 12 levels "Sprat","Sandeel",..: 1 1 1 1 1 1 1 1 1 1 ...
# }
# Returning the data frame
fr <- plotYield(sim, return_data = TRUE)
str(fr)
#> 'data.frame': 1212 obs. of 3 variables:
#> $ Year : num 0 0.2 0.4 0.6 0.8 1 1.2 1.4 1.6 1.8 ...
#> $ Yield : num 2.21e+11 1.86e+11 1.60e+11 1.42e+11 1.30e+11 ...
#> $ Species: Factor w/ 12 levels "Sprat","Sandeel",..: 1 1 1 1 1 1 1 1 1 1 ...
# }