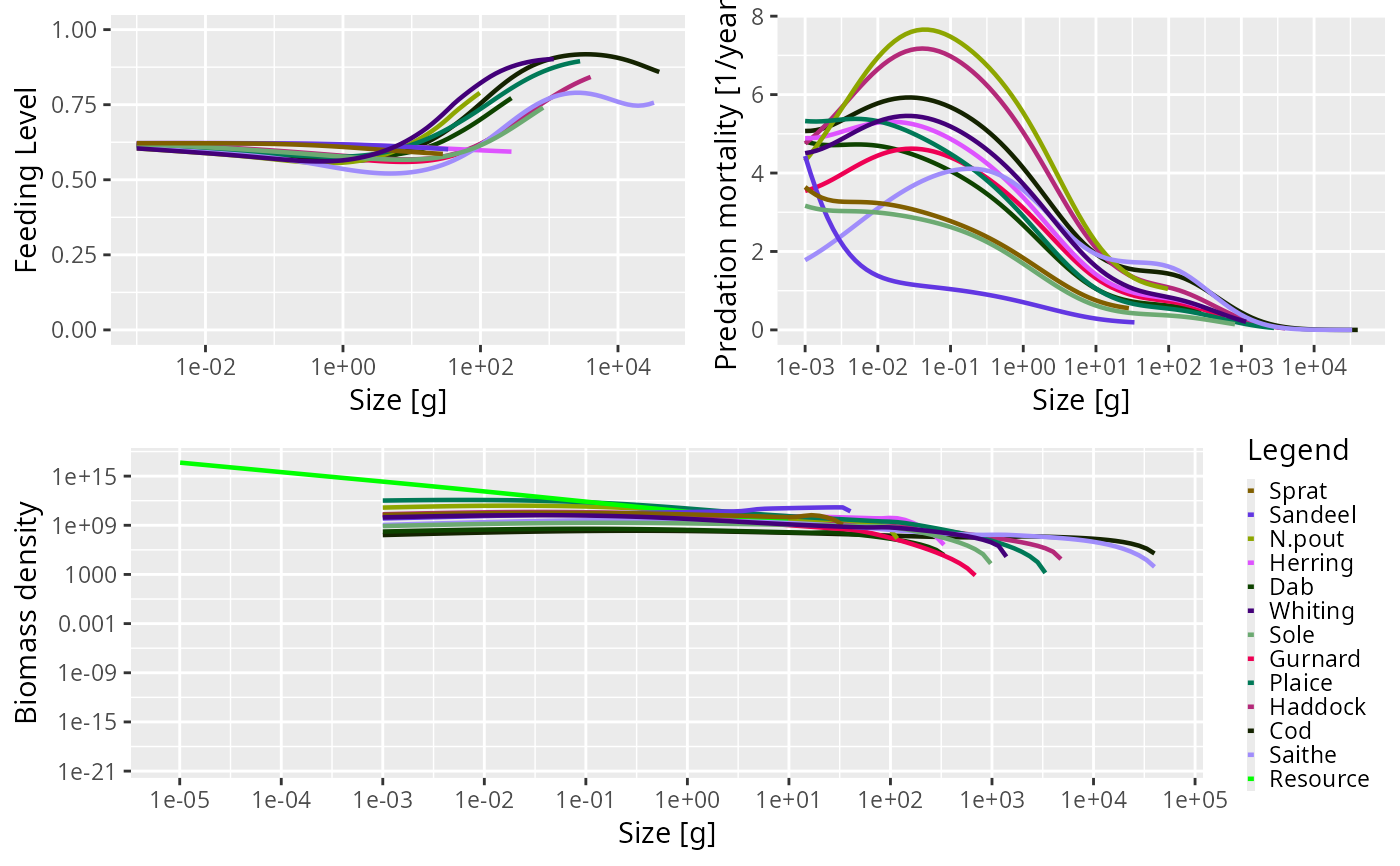
Produces 3 plots in the same window: abundance spectra, feeding
level and predation mortality of each species against size. This method just
puts the plots generated by plotFeedingLevel(), plotPredMort() and
plotSpectra() all in one window.
Usage
# S3 method for class 'MizerParams'
plot(x, ...)
Arguments
- x
An object of class MizerParams
- ...
Arguments passed on to the individual plotting functions
plotFeedingLevel(),plotSpectra(),plotPredMort()
See also
Other plotting functions:
addPlot(),
animate.ArrayTimeBySpeciesBySize(),
plot,
plot2(),
plotBiomass(),
plotCDF(),
plotCDF2(),
plotDiet(),
plotFMort(),
plotFeedingLevel(),
plotGrowthCurves(),
plotMizerSim,
plotPredMort(),
plotRelative(),
plotSpectra(),
plotSpectra2(),
plotSpectraRelative(),
plotYield(),
plotYieldGear(),
plotting_functions
Examples
# \donttest{
params <-  NS_params
plot(params)

# }
# }