Plot relative difference between two mizer arrays
Source:R/ArraySpeciesBySize-class.R, R/ArrayTimeBySpecies-class.R, R/ArrayTimeBySpeciesBySize-class.R
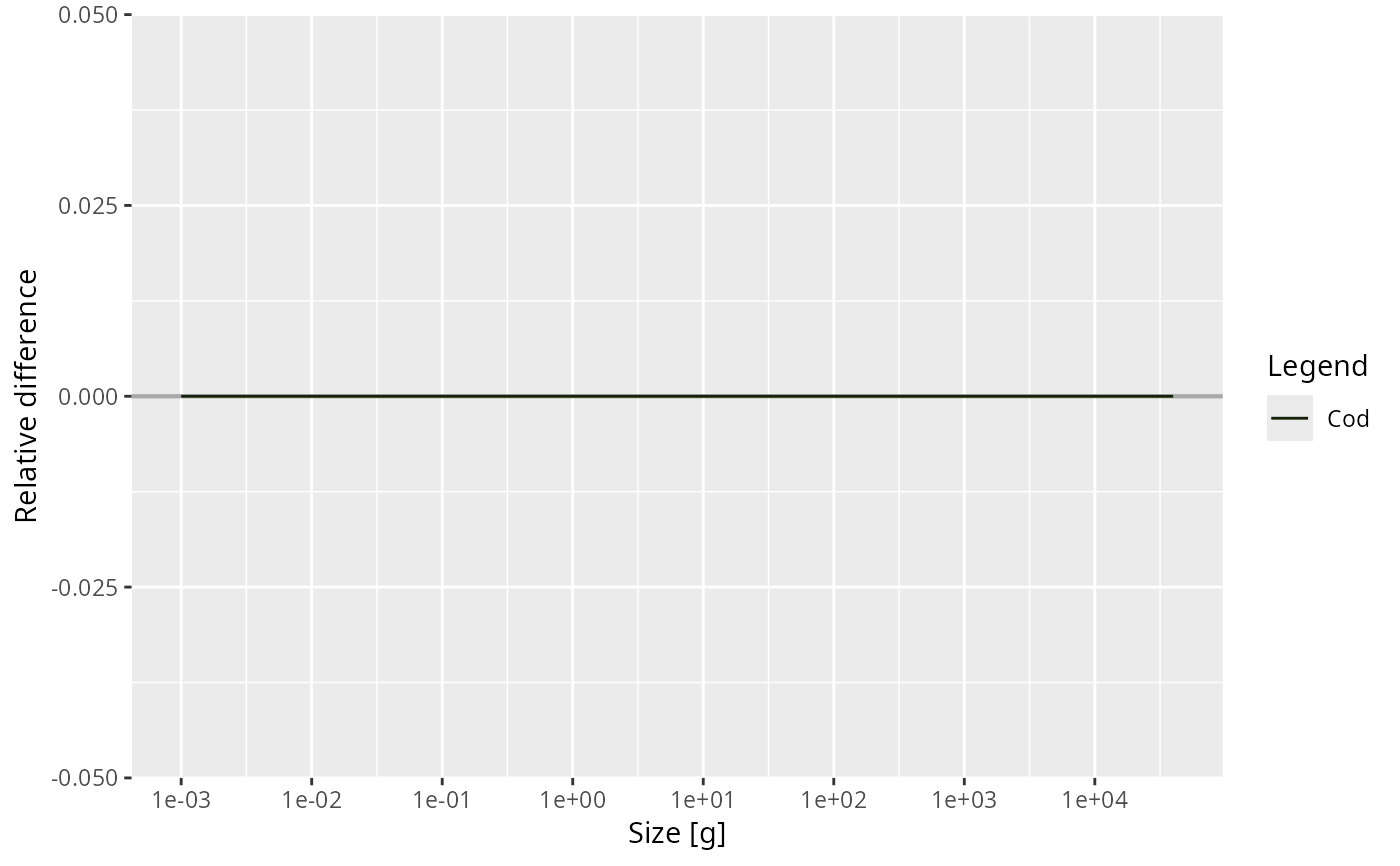
plotRelative.RdplotRelative() plots the difference between two compatible mizer array
objects relative to their average. If the values in the first object are
\(N_1\) and the values in the second are \(N_2\), it plots
$$2 (N_2 - N_1) / (N_1 + N_2).$$
Usage
plotRelative(
  x,
  y,
  species = NULL,
  log_x,
  ylim = c(NA, NA),
  total = FALSE,
  background = TRUE,
  ...
)
Arguments
- x
The first of two compatible mizer array objects to compare. Can be an
ArraySpeciesBySize,ArrayTimeBySpecies, orArrayTimeBySpeciesBySizeobject.- y
The second mizer array object, compatible with
x.- species
Character vector of species to include.
NULL(default) means all species.- log_x
If
TRUE, use a log10 x-axis. Default isTRUEfor size spectra andFALSEfor time series.- ylim
A numeric vector of length two providing lower and upper limits for the value (y) axis.
- total
A boolean value that determines whether the total over all selected species is plotted as well. Default is
FALSE.- background
A boolean value that determines whether background species are included. Ignored if the model does not contain background species. Default is
TRUE.- ...
Further arguments used by only some of the methods:
For
ArraySpeciesBySizeandArrayTimeBySpeciesBySizemethods:all.sizesIf
FALSE(default), values outside a species' size range (w_mintow_max) are removed.wlimA numeric vector of length two providing lower and upper limits for the weight (x) axis. Use
NAto refer to the existing minimum or maximum.llimA numeric vector of length two providing lower and upper limits for the length (x) axis when
size_axis = "l". UseNAto refer to the existing minimum or maximum.size_axisWhether to plot size as weight (
"w", default) or length ("l"), using the allometric weight-length relationship.
For
ArrayTimeBySpeciesmethods:tlimA numeric vector of length two providing lower and upper limits for the time axis, e.g.
c(1980, 2000). UseNAto apply no limit at that end. Default isc(NA, NA).
For
ArrayTimeBySpeciesBySizemethods:timeThe time to display. Default (
NULL) is the final time step.
See also
Other plotting functions:
addPlot(),
animate.ArrayTimeBySpeciesBySize(),
plot,
plot2(),
plotBiomass(),
plotCDF(),
plotCDF2(),
plotDiet(),
plotFMort(),
plotFeedingLevel(),
plotGrowthCurves(),
plotMizerParams,
plotMizerSim,
plotPredMort(),
plotSpectra(),
plotSpectra2(),
plotSpectraRelative(),
plotYield(),
plotYieldGear(),
plotting_functions
Examples
# \donttest{
params <- NS_params
given_species_params(params)["Cod", "w_mat"] <- 1200
plotRelative(getEGrowth(NS_params), getEGrowth(params),
             wlim = c(500, 2000), log_x = FALSE, species = "Cod")

# }
# }