S3 class for time x resource-size arrays
Source:R/ArrayResourceBySize-class.R
ArrayTimeByResourceBySize.Rd![[Experimental]](figures/lifecycle-experimental.svg) The
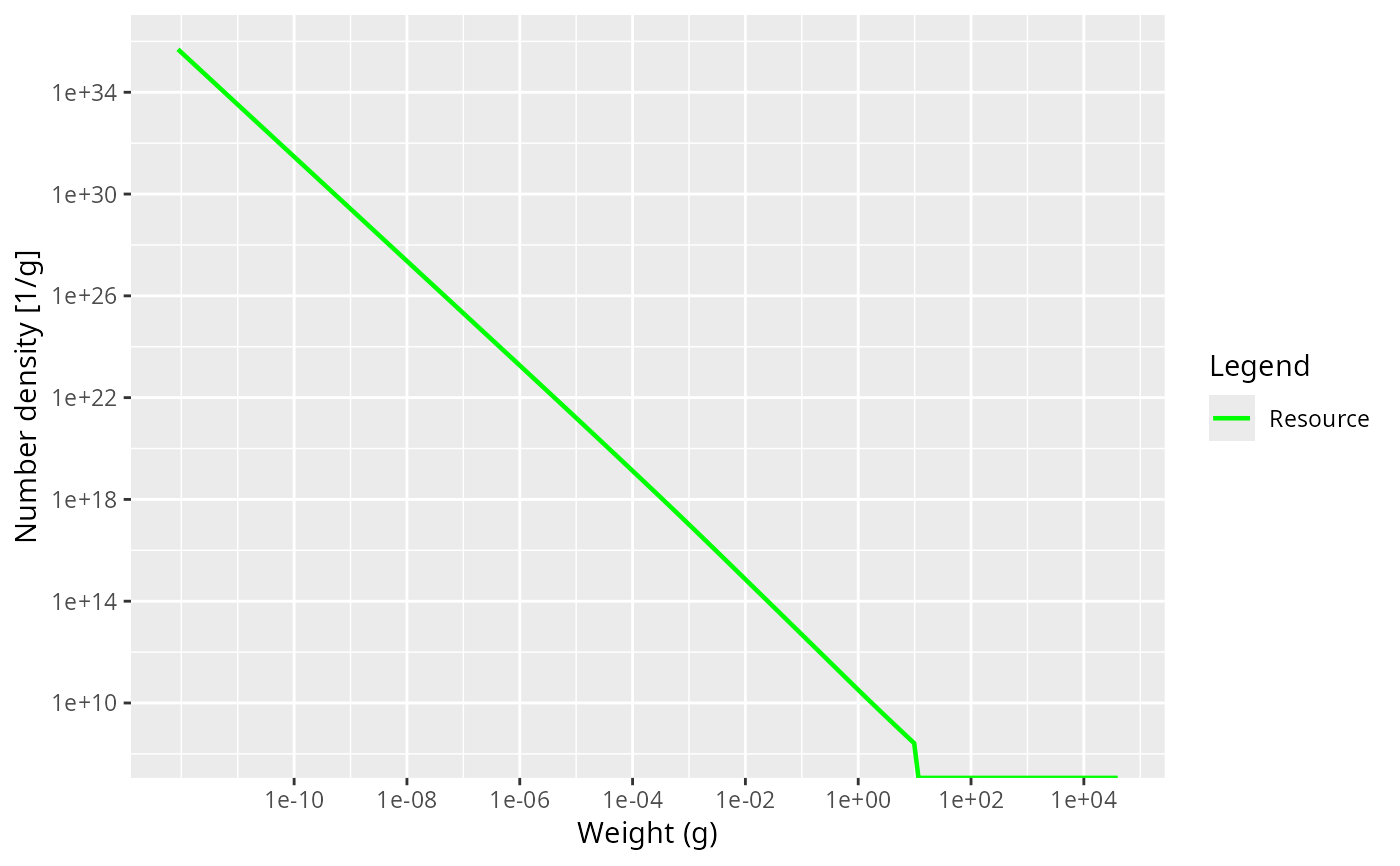
The NResource() function returns a two-dimensional array (time x size)
holding the resource number density through time. The
ArrayTimeByResourceBySize class wraps this array to provide convenient
print(), summary(), plot(), and as.data.frame() methods.
Usage
ArrayTimeByResourceBySize(
  x,
  value_name = NULL,
  units = NULL,
  type = NULL,
  params = NULL
)

is.ArrayTimeByResourceBySize(x)
Arguments
- x
A matrix (time x size). For
is.ArrayTimeByResourceBySize(), any object to test.- value_name
A string giving the human-readable name for the value.
- units
A string giving the units (e.g. "1/g").
- type
The kind of quantity the values are, see
ArraySpeciesBySize()and array_types.- params
A
MizerParamsobject. Used for the resource colour and the size grid in theplot()method.
Value
An ArrayTimeByResourceBySize object (inherits from matrix and
array).
is.ArrayTimeByResourceBySize() returns TRUE if x is an
ArrayTimeByResourceBySize object, FALSE otherwise.
Details
An ArrayTimeByResourceBySize object behaves just like a regular matrix for
arithmetic operations and subsetting. It carries these lightweight
attributes:
value_name– a human-readable name for the value (e.g. "Number density").units– the units of the value (e.g. "1/g").params– theMizerParamsobject that the value was computed from.