
![[Experimental]](figures/lifecycle-experimental.svg) Several functions in mizer return a vector over the full size grid holding
a resource-related quantity such as the resource number density, the
resource mortality, the intrinsic resource birth rate or carrying capacity.
The
Several functions in mizer return a vector over the full size grid holding
a resource-related quantity such as the resource number density, the
resource mortality, the intrinsic resource birth rate or carrying capacity.
The ArrayResourceBySize class wraps these vectors to provide convenient
print(), summary(), plot(), and as.data.frame() methods.
Usage
ArrayResourceBySize(
  x,
  value_name = NULL,
  units = NULL,
  type = NULL,
  params = NULL
)

is.ArrayResourceBySize(x)
Arguments
- x
A numeric vector over the full size grid. For
is.ArrayResourceBySize(), any object to test.- value_name
A string giving the human-readable name for the value.
- units
A string giving the units (e.g. "1/year").
- type
The kind of quantity the values are, see
ArraySpeciesBySize()and array_types.- params
A
MizerParamsobject. Used for the resource colour and the size grid in theplot()method.
Value
An ArrayResourceBySize object (inherits from numeric).
is.ArrayResourceBySize() returns TRUE if x is an
ArrayResourceBySize object, FALSE otherwise.
Details
An ArrayResourceBySize object behaves just like a regular numeric vector
for arithmetic operations and subsetting. It carries three lightweight
attributes:
value_name– a human-readable name for the value (e.g. "Resource mortality").units– the units of the value (e.g. "1/year").params– theMizerParamsobject that the value was computed from.
Examples
# \donttest{
mort <- getResourceMort(NS_params)
#> ℹ No `a` column so using a = 0.01 in w = a l^b, with w in g and l in cm.
#> ℹ No `b` column so using the isometric default b = 3 in w = a l^b.
is.ArrayResourceBySize(mort)
#> [1] TRUE
summary(mort)
#> Resource mortality [1/year]
#> 226 sizes
#>
#> Min Mean Max
#> 1.228364e-16 6.936203 24.10931
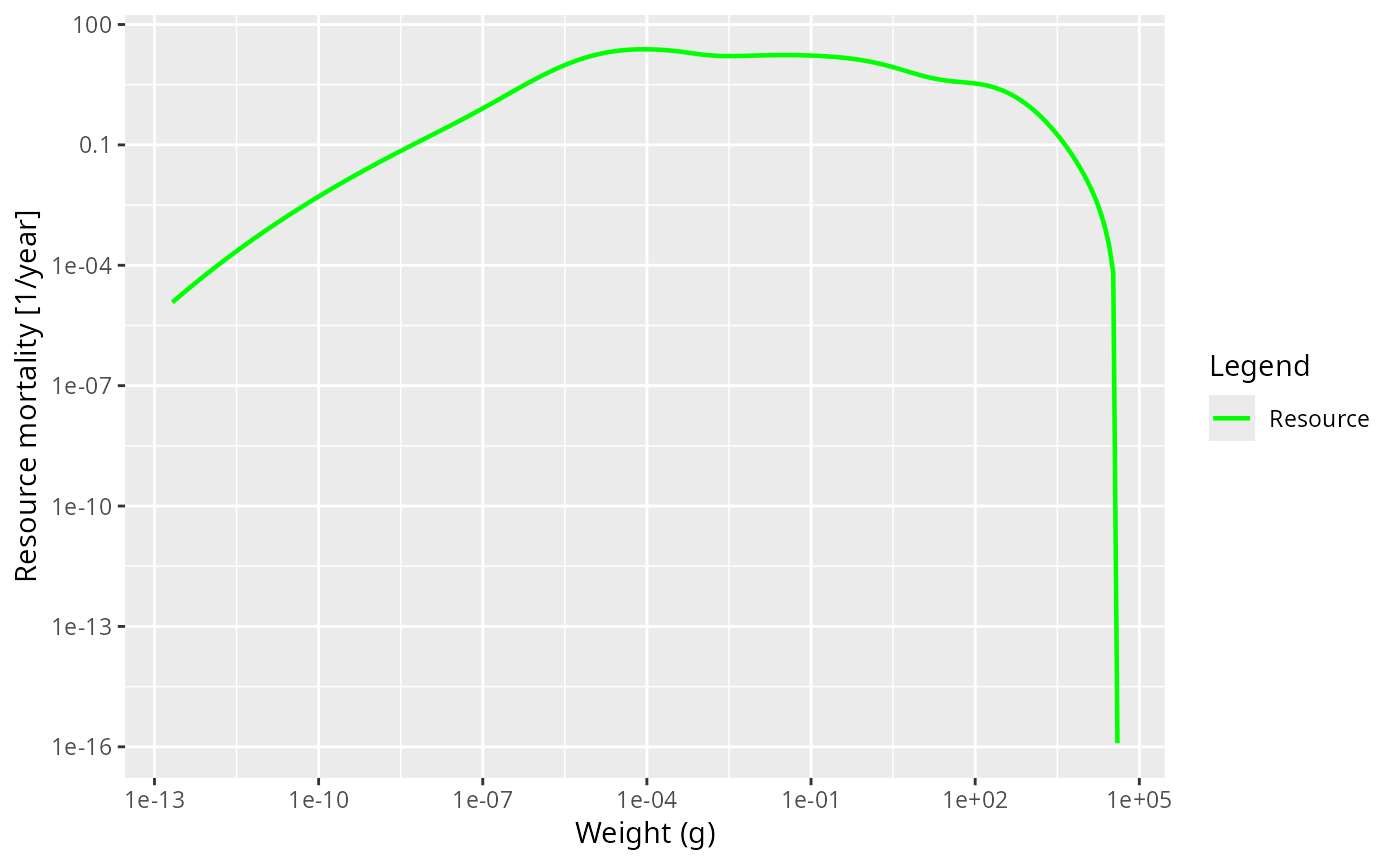
plot(mort)
 # }
# }