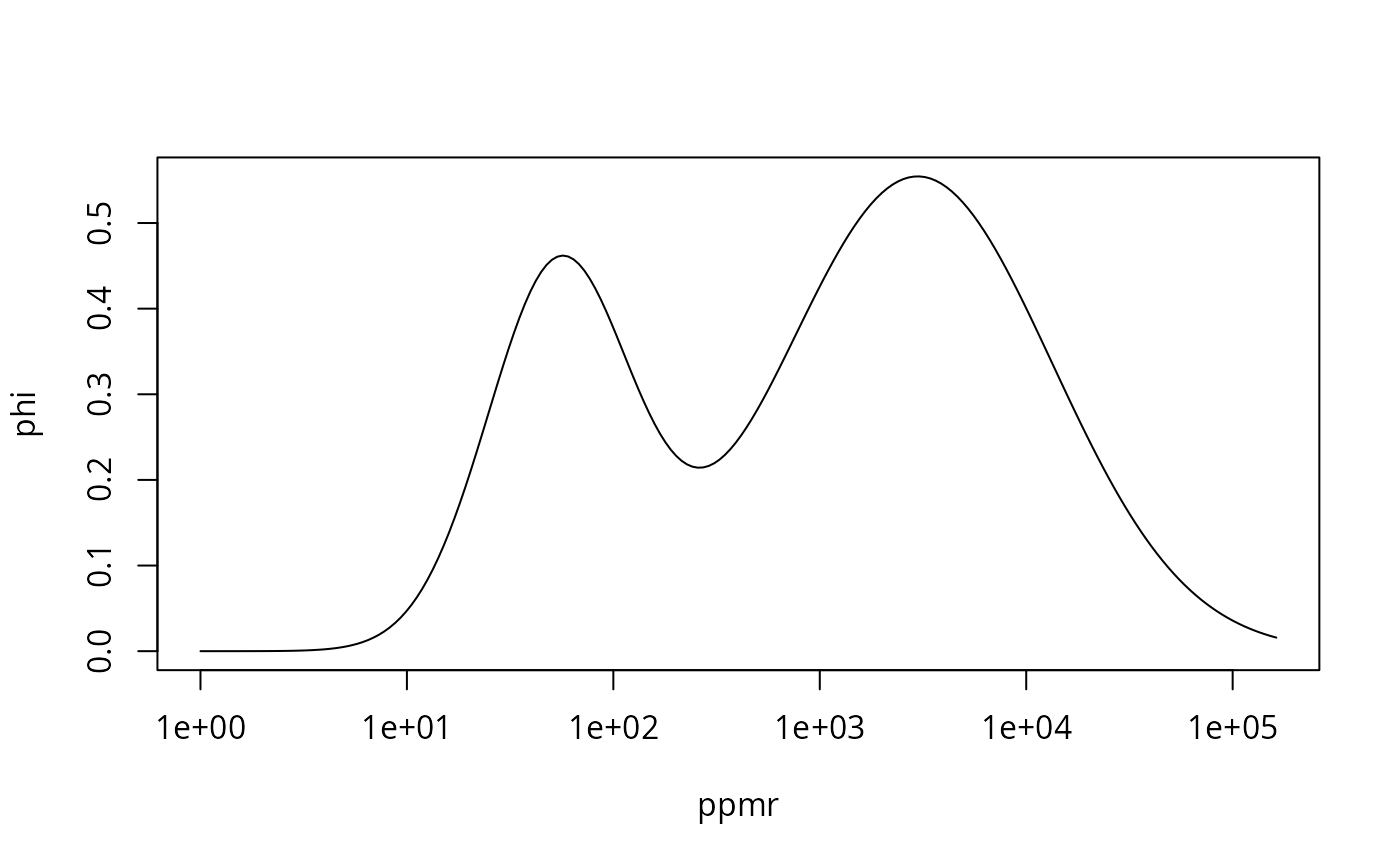
![[Experimental]](figures/lifecycle-experimental.svg) A predation kernel for which the log predator/prey mass ratio follows a
mixture of Gaussian distributions.
A predation kernel for which the log predator/prey mass ratio follows a
mixture of Gaussian distributions.
Value
A vector giving the value of the predation kernel at each of the
predator/prey mass ratios in the ppmr argument.
Details
Writing the predator mass as \(w\), the prey mass as \(w_p\), and \(x = \ln(w / w_p)\), the feeding kernel is $$ \phi_i(w, w_p) = \sum_j a_{ij} \exp\left[-\frac{(x - \mu_{ij})^2}{2\sigma_{ij}^2}\right], \qquad a_{ij} = \frac{p_{ij}/\sigma_{ij}} {\sum_k p_{ik}/\sigma_{ik}}. $$ for predator/prey mass ratios greater than or equal to one, and zero for smaller ratios.
This is proportional to the Gaussian-mixture probability density with
mixing proportions \(p_{ij}\), means \(\mu_{ij}\), and standard
deviations \(\sigma_{ij}\). The scaling makes the sum of the component
peak heights equal to one. Consequently the kernel is at most one, and a
one-component mixture is identical to lognormal_pred_kernel() with
beta = exp(kernel_mean) and sigma = kernel_sd.
The three component parameters are vectors of equal length. When this
function is selected in a species parameter data frame, they should be held
in the list-columns kernel_p, kernel_mean, and kernel_sd. The values in
kernel_p must be non-negative with at least one positive value, but they do
not need to sum to one because they are normalised by the function.
See also
Other predation kernel:
box_pred_kernel(),
lognormal_pred_kernel(),
power_law_pred_kernel(),
truncated_lognormal_pred_kernel()