
Plot method for ArraySpeciesBySize objects
Source: R/ArraySpeciesBySize-class.R
plot.ArraySpeciesBySize.RdSee plot() for an overview of the mizer plotting system and the
arguments shared by all of its methods.
Usage
# S3 method for class 'ArraySpeciesBySize'
plot(
  x,
  species = NULL,
  all.sizes = FALSE,
  highlight = NULL,
  return_data = FALSE,
  log_x = TRUE,
  log_y = FALSE,
  log = NULL,
  wlim = c(NA, NA),
  llim = c(NA, NA),
  ylim = c(NA, NA),
  size_axis = c("w", "l"),
  per_log_size = NULL,
  total = FALSE,
  background = TRUE,
  y_ticks = 6,
  ...
)
Arguments
- x
An
ArraySpeciesBySizeobject.- species
Character vector of species to include.
NULL(default) means all species.- all.sizes
If
FALSE(default), values outside a species' size range (w_mintow_max) are removed.- highlight
Name or vector of names of the species to be highlighted.
- return_data
If
TRUE, return the data frame instead of the plot.- log_x
If
TRUE, use a log10 x-axis. Default isTRUE.- log_y
If
TRUE, use a log10 y-axis. Default isFALSE.- log
Character string specifying which axes should use log10 scales, in the same form as the base
plot()argument. For example,"x","y","xy"or"". If supplied, this overrideslog_xandlog_y.- wlim
A numeric vector of length two providing lower and upper limits for the weight (x) axis. Use
NAto refer to the existing minimum or maximum.- llim
A numeric vector of length two providing lower and upper limits for the length (x) axis when
size_axis = "l". UseNAto refer to the existing minimum or maximum.- ylim
A numeric vector of length two providing lower and upper limits for the value (y) axis. Use
NAto refer to the existing minimum or maximum.- size_axis
Whether to plot size as weight (
"w", default) or length ("l"), using the allometric weight-length relationship.- per_log_size
For an array that holds a density, whether to plot it per logarithmic size (
TRUE) rather than per size (FALSE). The default,NULL, plots the density as it stands. Unlikesize_axisthis needs no weight-length relationship, so it is available for the resource classes too. An error for an array that does not hold a density.- total
A boolean value that determines whether the total is plotted as well. The total is the total of everything the array holds, every species and every size, whatever is drawn. Default is
FALSE.- background
A boolean value that determines whether background species are included. Ignored if the model does not contain background species. Default is
TRUE.- y_ticks
The approximate number of ticks desired on the y axis.
- ...
Unused.
Examples
# \donttest{
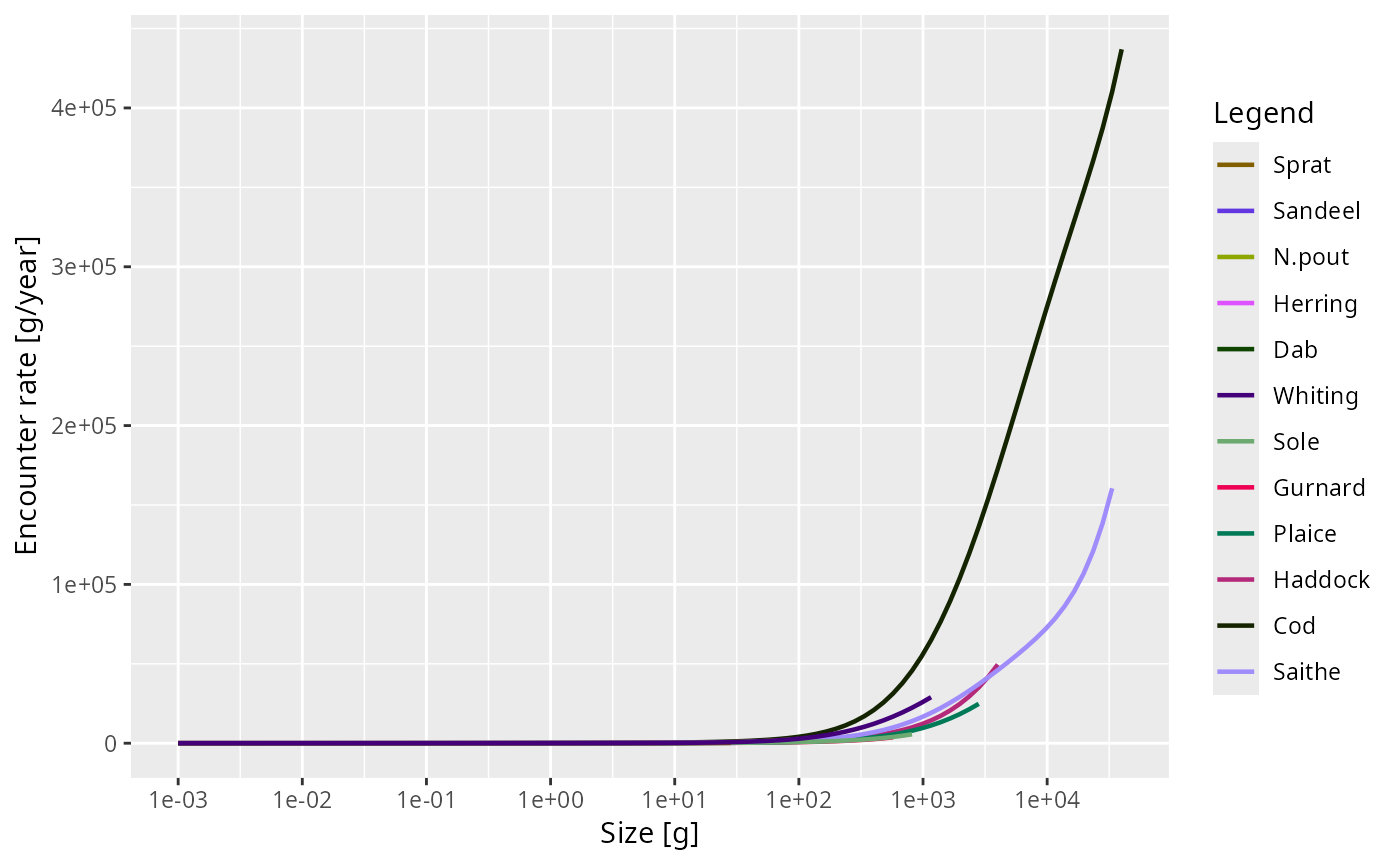
plot(getEncounter(NS_params))
#> ℹ No `a` column so using a = 0.01 in w = a l^b, with w in g and l in cm.
#> ℹ No `b` column so using the isometric default b = 3 in w = a l^b.
#> ℹ No `a` column so using a = 0.01 in w = a l^b, with w in g and l in cm.
#> ℹ No `b` column so using the isometric default b = 3 in w = a l^b.
#> ℹ No `a` column so using a = 0.01 in w = a l^b, with w in g and l in cm.
#> ℹ No `b` column so using the isometric default b = 3 in w = a l^b.
#> ℹ No `a` column so using a = 0.01 in w = a l^b, with w in g and l in cm.
#> ℹ No `b` column so using the isometric default b = 3 in w = a l^b.
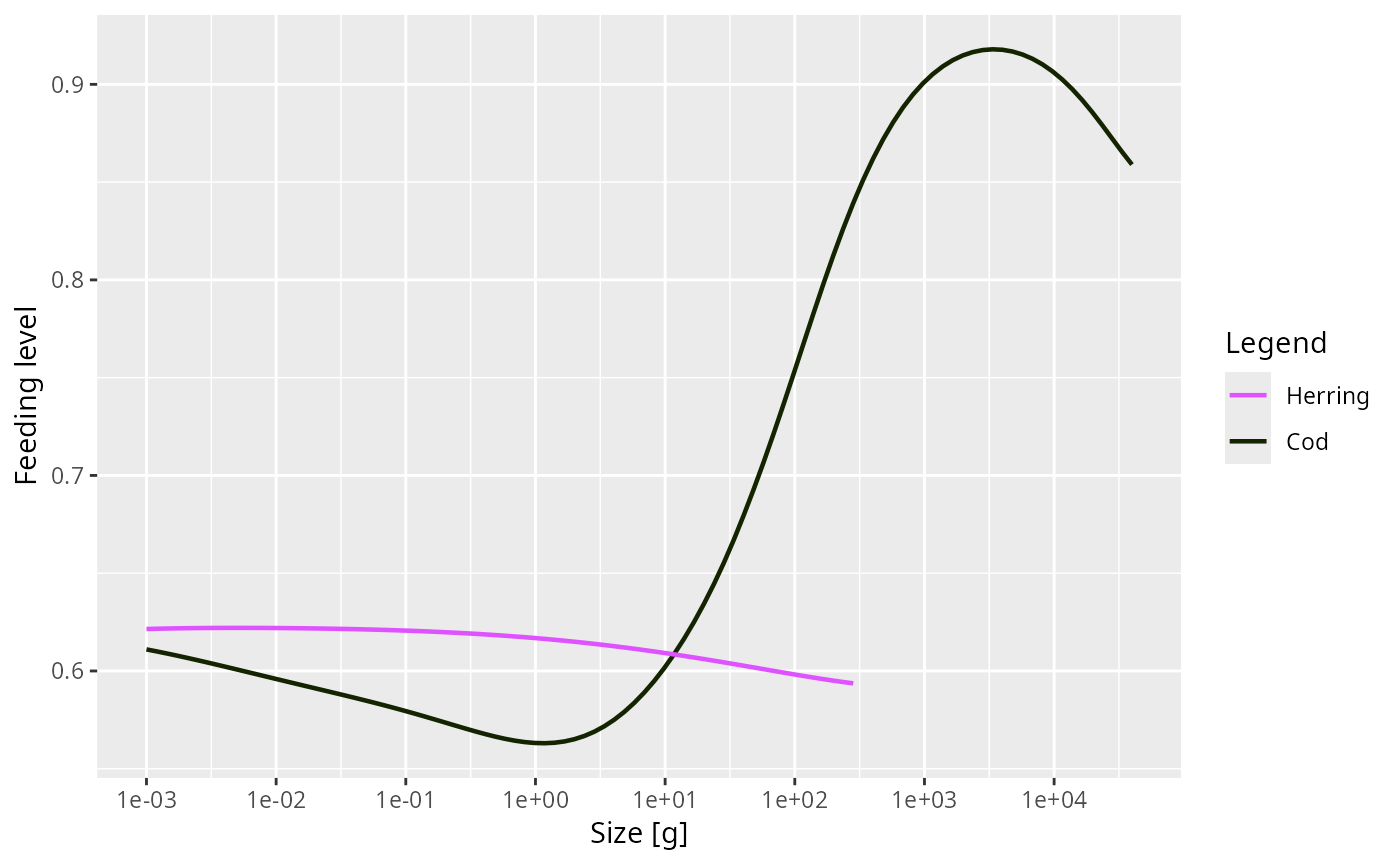
 plot(getFeedingLevel(NS_params), species = c("Cod", "Herring"))
#> ℹ No `a` column so using a = 0.01 in w = a l^b, with w in g and l in cm.
#> ℹ No `b` column so using the isometric default b = 3 in w = a l^b.
plot(getFeedingLevel(NS_params), species = c("Cod", "Herring"))
#> ℹ No `a` column so using a = 0.01 in w = a l^b, with w in g and l in cm.
#> ℹ No `b` column so using the isometric default b = 3 in w = a l^b.
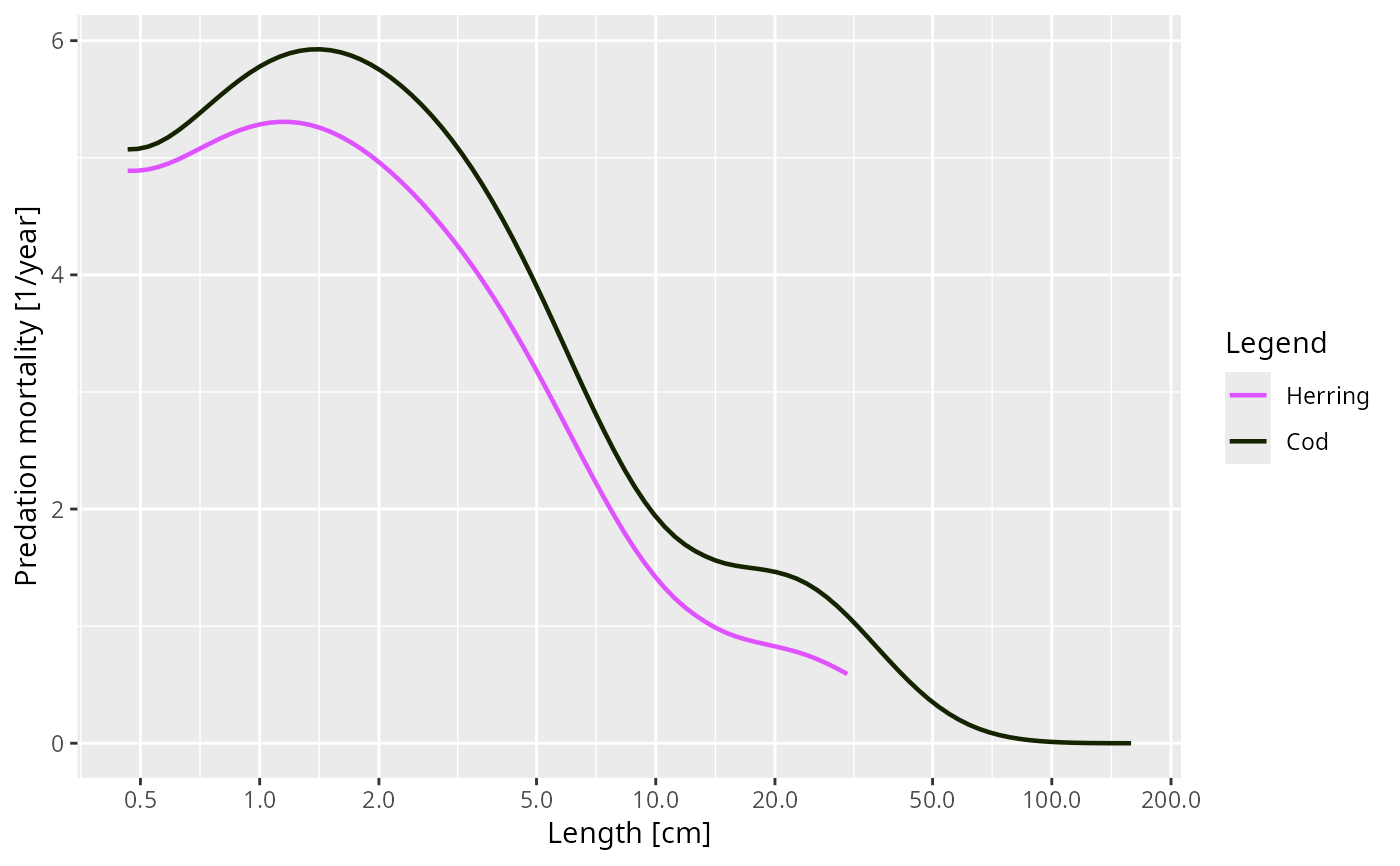
 plot(getPredMort(NS_params), species = c("Cod", "Herring"),
size_axis = "l")
#> ℹ No `a` column so using a = 0.01 in w = a l^b, with w in g and l in cm.
#> ℹ No `b` column so using the isometric default b = 3 in w = a l^b.
plot(getPredMort(NS_params), species = c("Cod", "Herring"),
size_axis = "l")
#> ℹ No `a` column so using a = 0.01 in w = a l^b, with w in g and l in cm.
#> ℹ No `b` column so using the isometric default b = 3 in w = a l^b.
 # }
# }