S3 class for time x species x size arrays
Source:R/ArrayTimeBySpeciesBySize-class.R
ArrayTimeBySpeciesBySize.RdSome functions in mizer return three-dimensional arrays (time x species x
size) holding quantities like fishing mortality, feeding level, or predation
mortality through time. The ArrayTimeBySpeciesBySize class wraps these
arrays to provide convenient print(), summary(), plot(),
animate(), and as.data.frame() methods.
Usage
ArrayTimeBySpeciesBySize(
  x,
  value_name = NULL,
  units = NULL,
  params = NULL,
  representation = c("point", "average")
)

is.ArrayTimeBySpeciesBySize(x)
Arguments
- x
A 3D array (time x species x size). For
is.ArrayTimeBySpeciesBySize(), any object to test.- value_name
A string giving the human-readable name for the value.
- units
A string giving the units (e.g. "1/year").
- params
A
MizerParamsobject. Used for species colours, linetypes, and size ranges in theplot()andanimateSpectra()methods.- representation
Either
"point"(the default) for a quantity sampled at the grid nodes, or"average"for a finite-volume bin average, which is then drawn at the geometric bin centre when the model uses second-order bin-averaging (second_order_w[["bin_average"]]). SeeArraySpeciesBySize().
Value
An ArrayTimeBySpeciesBySize object (inherits from array).
is.ArrayTimeBySpeciesBySize() returns TRUE if x is an
ArrayTimeBySpeciesBySize object, FALSE otherwise.
Details
An ArrayTimeBySpeciesBySize object behaves just like a regular array for
arithmetic operations and subsetting. It carries these lightweight attributes:
value_name– a human-readable name for the value (e.g. "Fishing mortality").units– the units of the value (e.g. "1/year").params– theMizerParamsobject that the value was computed from.
Examples
# \donttest{
fmort <- getFMort(NS_sim)
is.ArrayTimeBySpeciesBySize(fmort)
#> [1] TRUE
summary(fmort)
#> Fishing mortality [1/year]
#> 44 times x 12 species x 100 sizes
#>
#> Species Min Mean Max
#> Sprat 0.0000000000 0.33743869 2.1827924
#> Sandeel 0.0000000000 0.26816487 1.3102141
#> N.pout 0.0000000000 0.30707882 2.1827924
#> Herring 0.0077894362 0.32918211 1.9100547
#> Dab 0.0017746971 0.04908083 0.1734253
#> Whiting 0.0126246154 0.33123701 1.3975648
#> Sole 0.0268320133 0.30068824 1.1274436
#> Gurnard 0.0000000000 0.01269037 0.1307616
#> Plaice 0.0089964121 0.24671481 0.8671267
#> Haddock 0.0015854377 0.31410333 1.4275908
#> Cod 0.0494762790 0.37063678 1.0721081
#> Saithe 0.0009633361 0.15709914 1.2032865
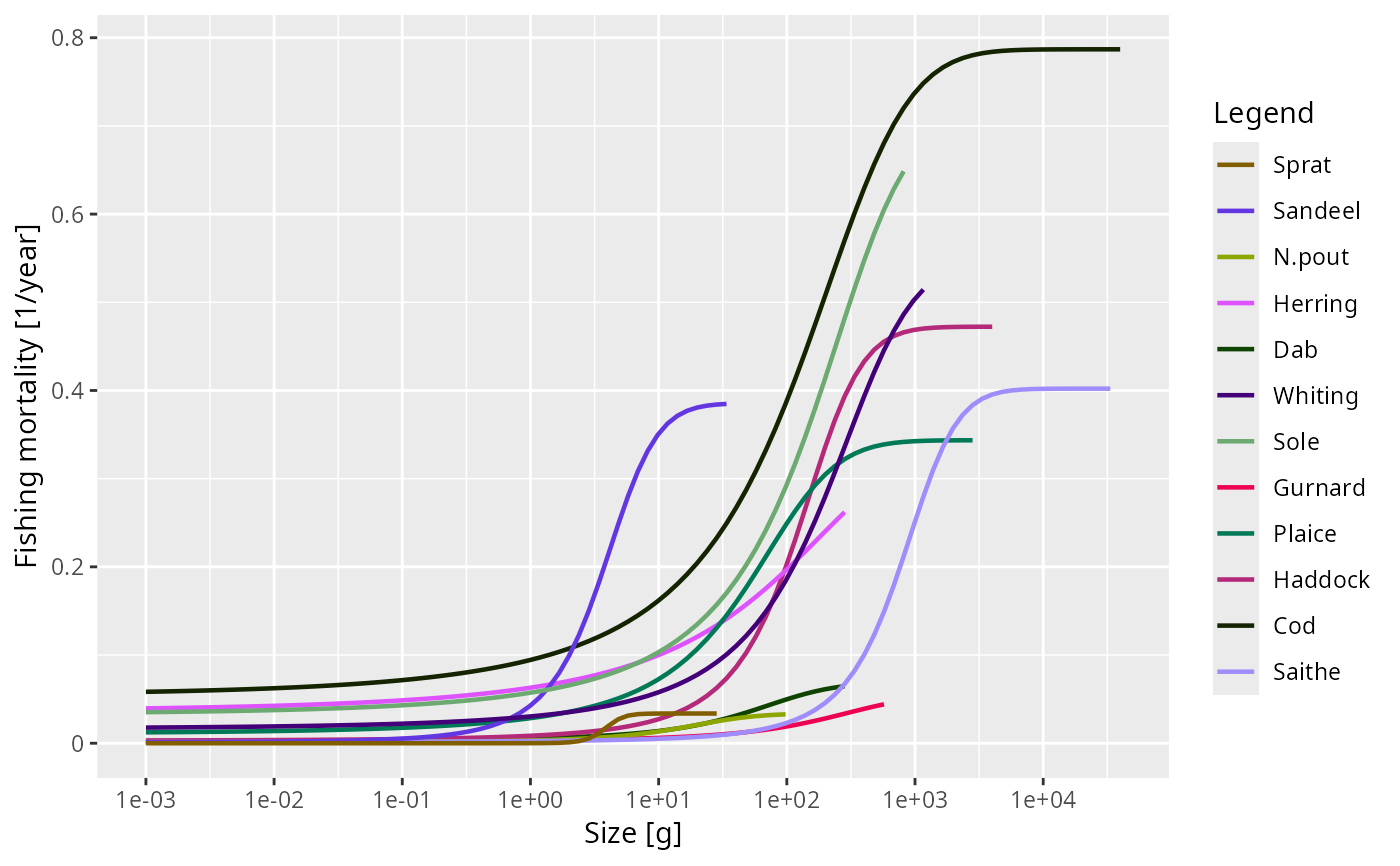
plot(fmort, time = 2007)
 # }
# }