Plot method for ArrayTimeByResourceBySize objects
Source: R/ArrayResourceBySize-class.R
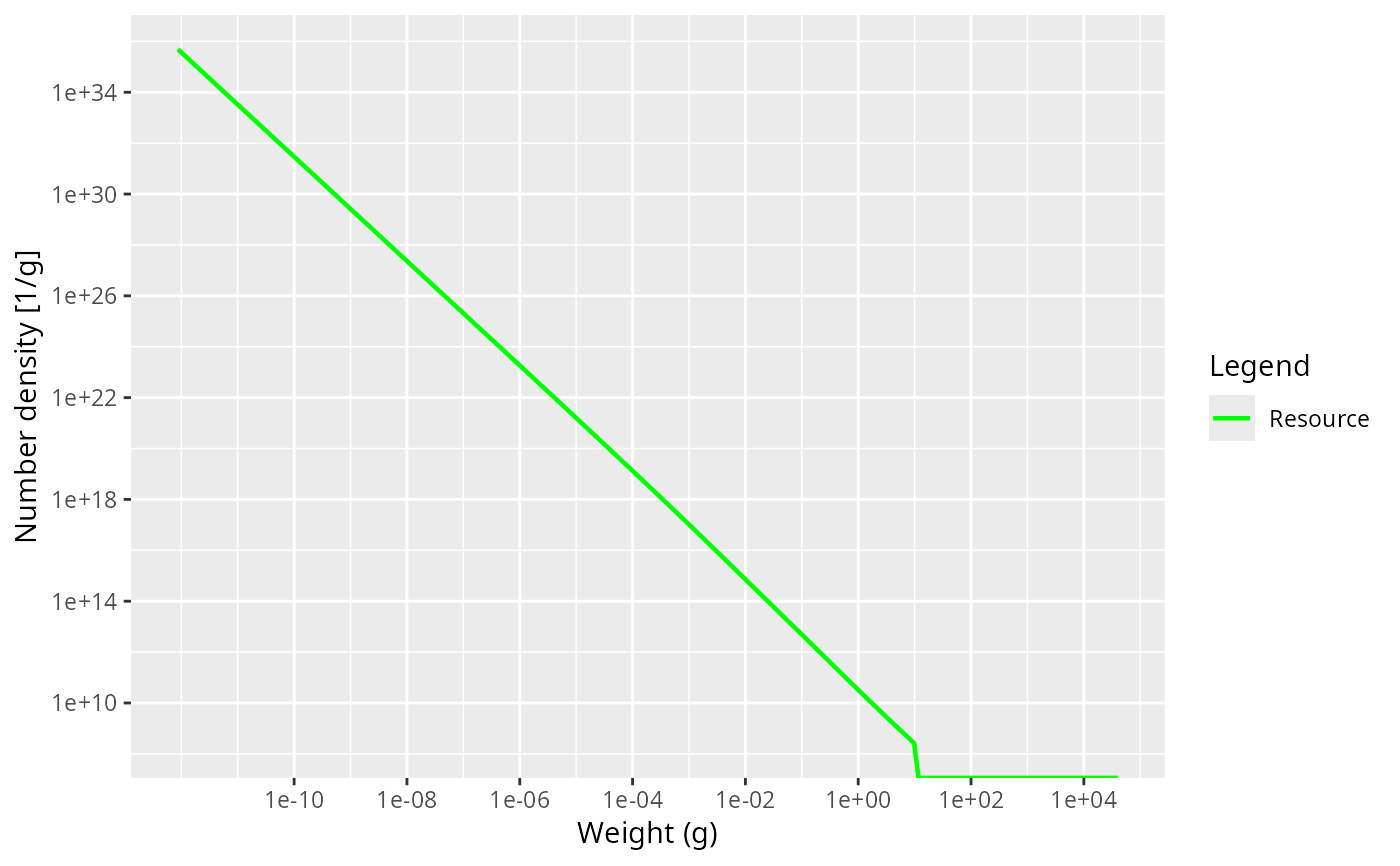
plot.ArrayTimeByResourceBySize.RdSee plot() for an overview of the mizer plotting system. This method
plots a single time slice, by first extracting it as an
ArrayResourceBySize object and delegating to
plot.ArrayResourceBySize(), which the further arguments in ... are
passed on to.
Usage
# S3 method for class 'ArrayTimeByResourceBySize'
plot(x, time = NULL, ...)
Arguments
- x
An
ArrayTimeByResourceBySizeobject.- time
The time to display. Default (
NULL) is the final time step.- ...
Passed on to
plot.ArrayResourceBySize().