Plotting observed vs. model biomass data
Source:R/plotBiomassObservedVsModel.R
plotBiomassObservedVsModel.Rd![[Experimental]](figures/lifecycle-experimental.svg) If biomass observations are available for at least some species via the
If biomass observations are available for at least some species via the
biomass_observed column in the species parameter data frame, this function
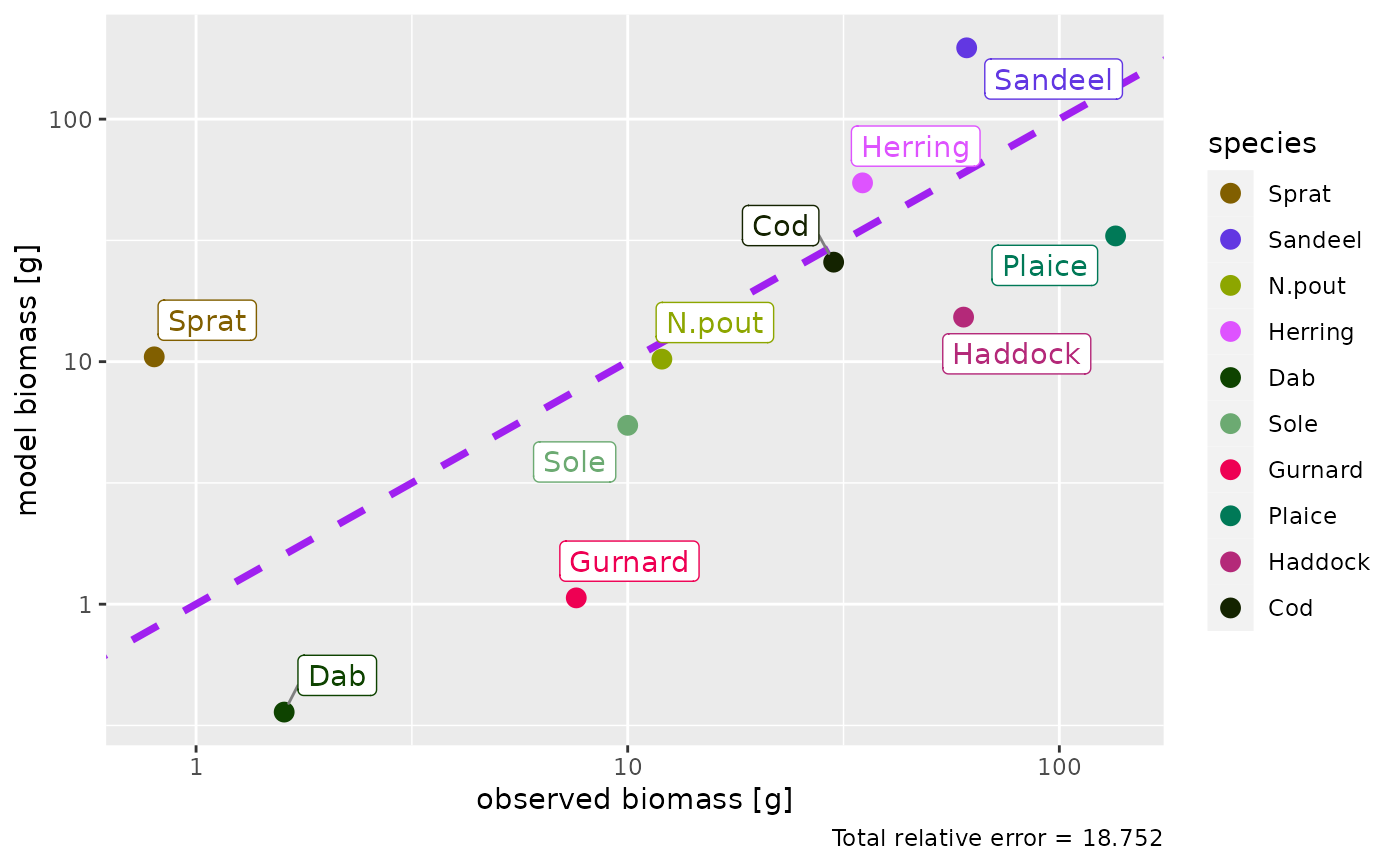
plots the biomass of each species in the model against the observed
biomasses. When called with a MizerSim object, the plot will use the model
biomasses predicted for the final time step in the simulation. ratio
defaults to FALSE.
Usage
plotBiomassObservedVsModel(
  object,
  species = NULL,
  ratio = FALSE,
  log_scale = TRUE,
  return_data = FALSE,
  labels = TRUE,
  show_unobserved = FALSE,
  ...
)
Arguments
- object
An object of class MizerParams or MizerSim.
- species
The species to be included. Optional. By default all observed biomasses will be included. A vector of species names, or a numeric vector with the species indices, or a logical vector indicating for each species whether it is to be included (TRUE) or not.
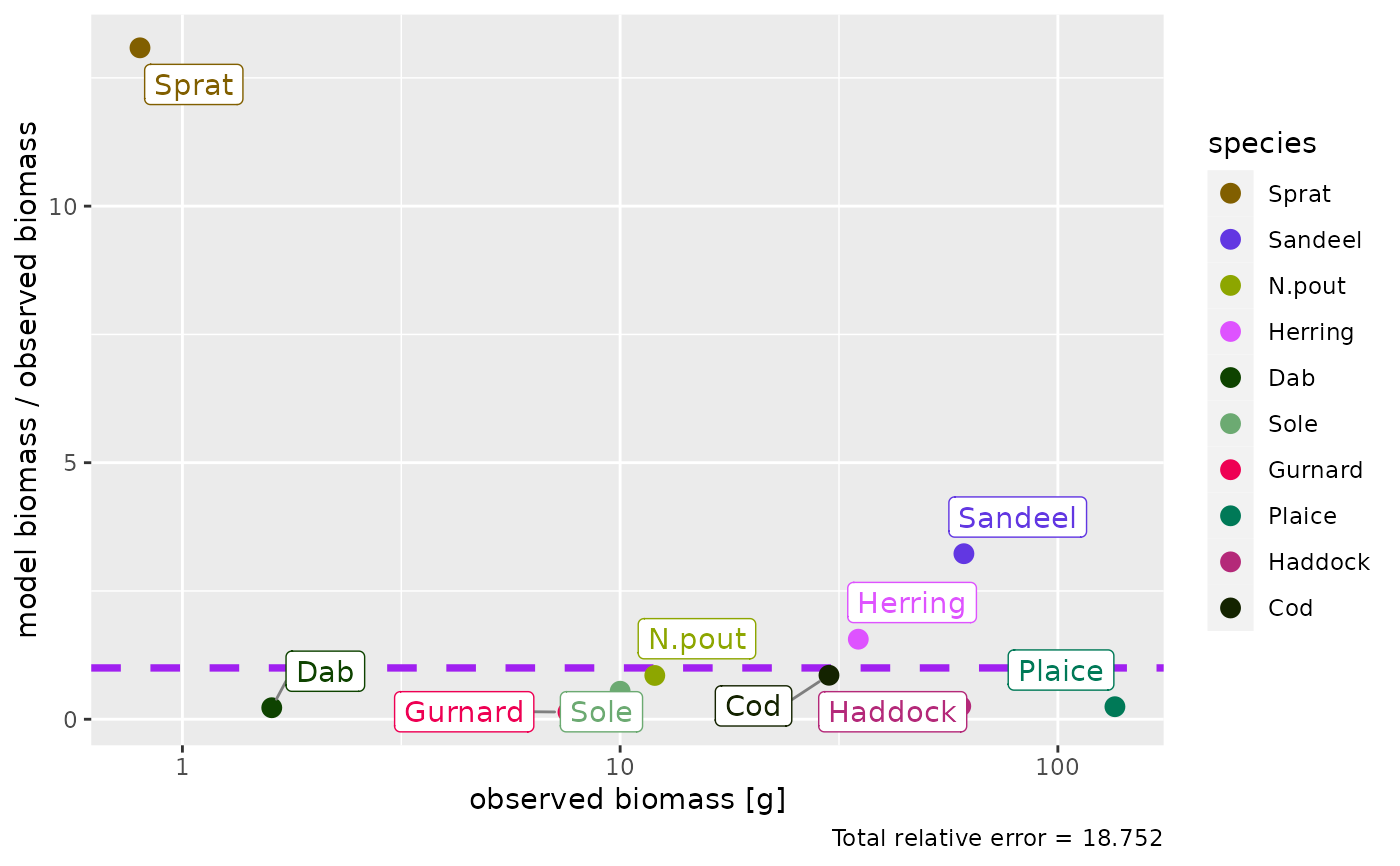
- ratio
Whether to plot model biomass vs. observed biomass (FALSE) or the ratio of model : observed biomass (TRUE). Default is FALSE.
- log_scale
Whether to plot on the log10 scale (TRUE) or not (FALSE). For the non-ratio plot this applies for both axes, for the ratio plot only the x-axis is on the log10 scale. Default is TRUE.
- return_data
Whether to return the data frame for the plot (TRUE) or not (FALSE). Default is FALSE.
- labels
Whether to show text labels for each species (TRUE) or not (FALSE). Default is TRUE.
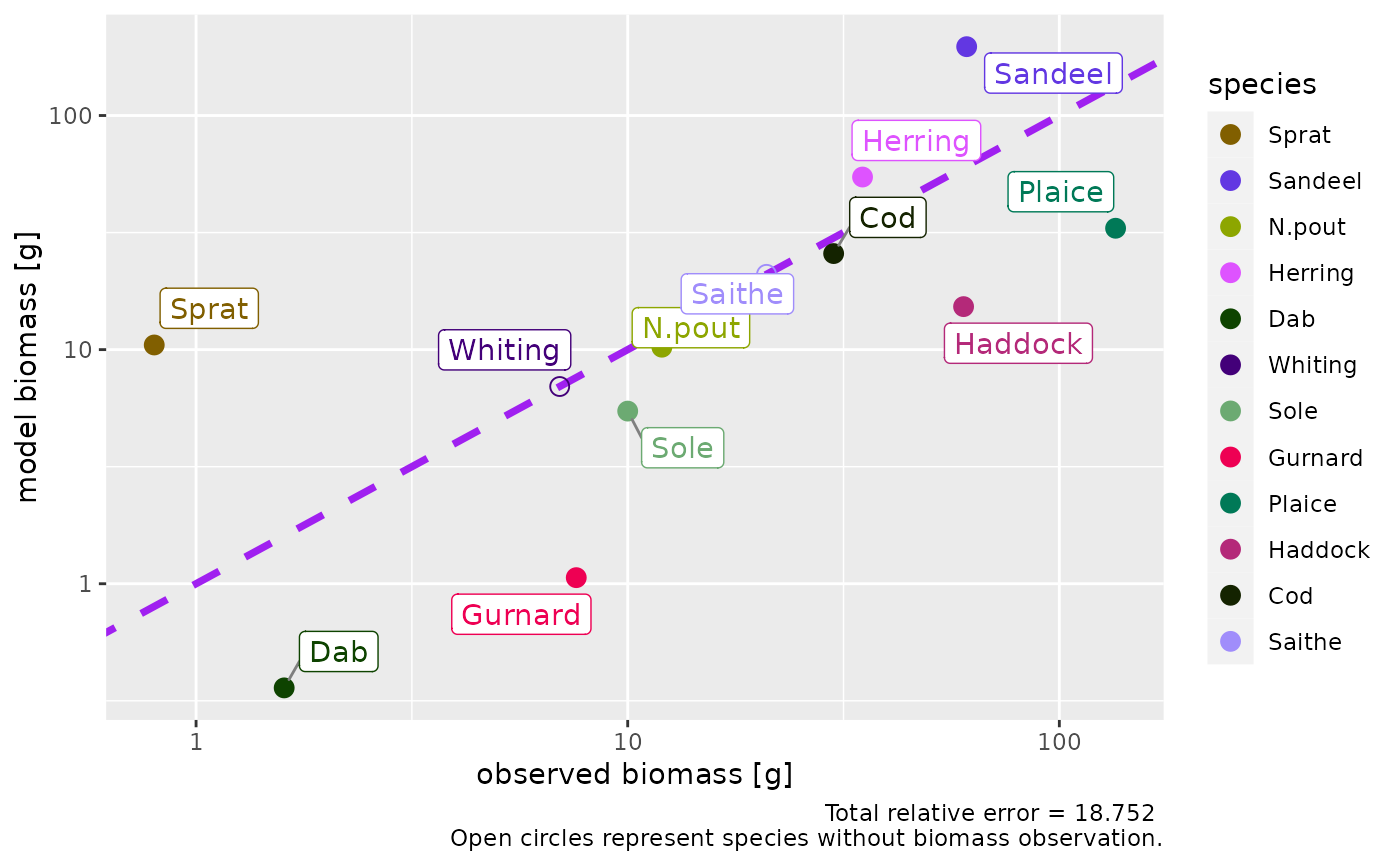
- show_unobserved
Whether to include also species for which no biomass observation is available. If TRUE, these species will be shown as if their observed biomass was equal to the model biomass.
- ...
For
plotlyBiomassObservedVsModel(), additional arguments passed toplotHover(). Otherwise unused.
Value
A ggplot2 object with the plot of model biomass by species compared
to observed biomass. If return_data = TRUE, the data frame used to
create the plot is returned instead of the plot.
Details
Before you can use this function you will need to have added a
biomass_observed column to your model which gives the observed biomass in
grams. For species for which you have no observed biomass, you should set
the value in the biomass_observed column to 0 or NA.
Biomass observations usually only include individuals above a certain size.
This size should be specified in a biomass_cutoff column of the species
parameter data frame. If this is missing, it is assumed that all sizes are
included in the observed biomass, i.e., it includes larval biomass.
The total relative error is shown in the caption of the plot, calculated by $$TRE = \sum_i|1-\rm{ratio_i}|$$ where \(\rm{ratio_i}\) is the ratio of model biomass / observed biomass for species i.
Examples
# create an example
params <- NS_params
species_params(params)$biomass_observed <-
c(0.8, 61, 12, 35, 1.6, NA, 10, 7.6, 135, 60, 30, NA)
species_params(params)$biomass_cutoff <- 10
params <- calibrateBiomass(params)
# Plot with default options
plotBiomassObservedVsModel(params, ratio = FALSE)
 # Plot including also species without observations
plotBiomassObservedVsModel(params, show_unobserved = TRUE, ratio = FALSE)
# Plot including also species without observations
plotBiomassObservedVsModel(params, show_unobserved = TRUE, ratio = FALSE)
 # Show the ratio instead
plotBiomassObservedVsModel(params, ratio = TRUE)
# Show the ratio instead
plotBiomassObservedVsModel(params, ratio = TRUE)