![[Deprecated]](figures/lifecycle-deprecated.svg) An alias provided for backward compatibility with mizer version <= 1.0
An alias provided for backward compatibility with mizer version <= 1.0
Usage
plotM2(
  object,
  species = NULL,
  time_range,
  all.sizes = FALSE,
  highlight = NULL,
  return_data = FALSE,
  ...
)
Arguments
- object
An object of class MizerSim or MizerParams.
- species
The species to be selected. Optional. By default all target species are selected. A vector of species names, or a numeric vector with the species indices, or a logical vector indicating for each species whether it is to be selected (TRUE) or not.
- time_range
The time range (either a vector of values, a vector of min and max time, or a single value) to average the abundances over. Default is the final time step. Ignored when called with a MizerParams object.
- all.sizes
If TRUE, then predation mortality is plotted also for sizes outside a species' size range. Default FALSE.
- highlight
Name or vector of names of the species to be highlighted.
- return_data
A boolean value that determines whether the formatted data used for the plot is returned instead of the plot itself. Default value is FALSE
- ...
Other arguments (currently unused)
Value
A ggplot2 object, unless return_data = TRUE, in which case a data
frame with the three variables 'w', 'value', 'Species' is returned.
See also
plotting_functions, getPredMort()
Other plotting functions:
animateSpectra(),
plot,MizerSim,missing-method,
plotBiomass(),
plotDiet(),
plotFMort(),
plotFeedingLevel(),
plotGrowthCurves(),
plotSpectra(),
plotYield(),
plotYieldGear(),
plotting_functions
Examples
# \donttest{
params <- NS_params
sim <- project(params, effort=1, t_max=20, t_save = 2, progress_bar = FALSE)
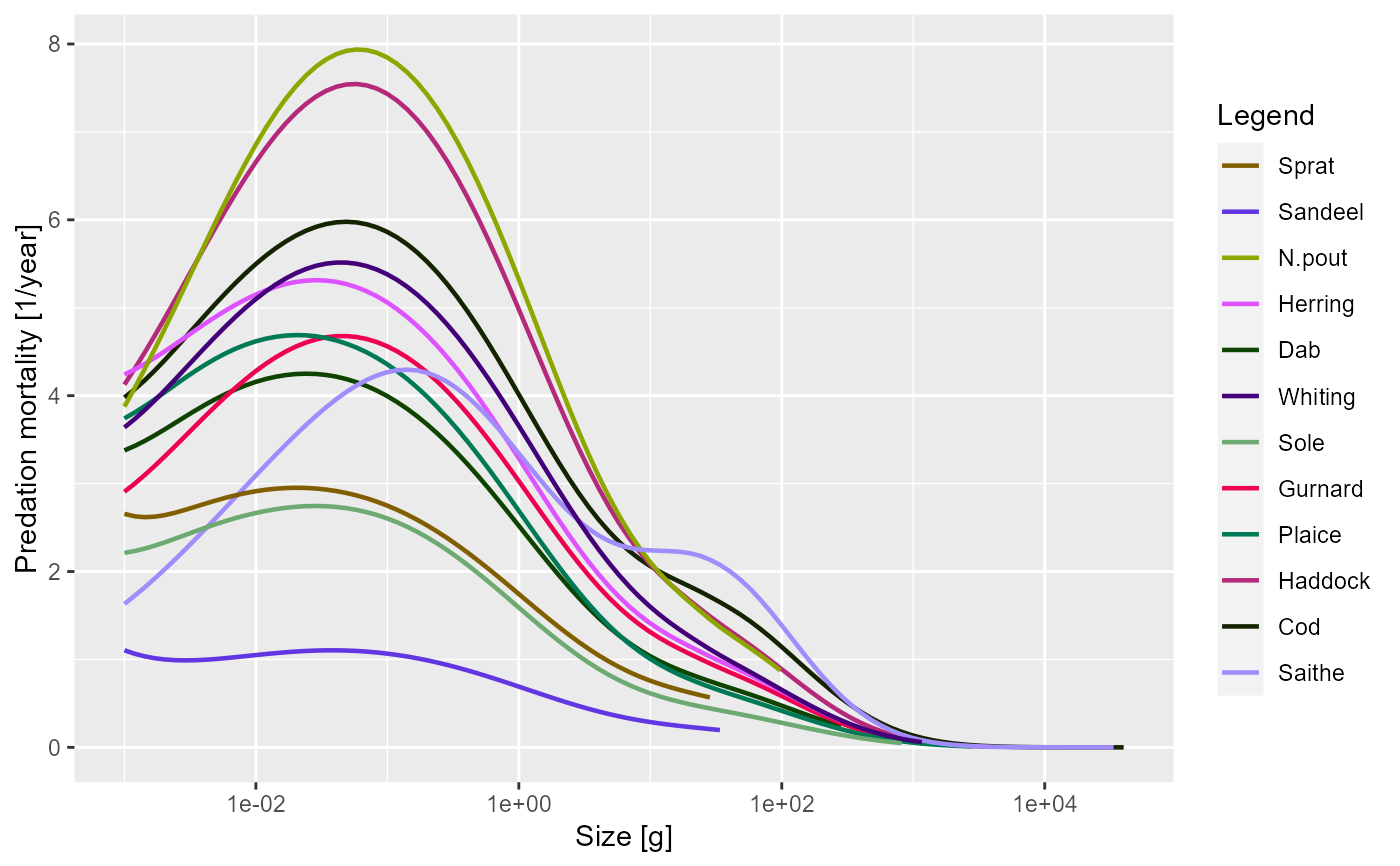
plotPredMort(sim)
 plotPredMort(sim, time_range = 10:20)
 # Returning the data frame
fr <- plotPredMort(sim, return_data = TRUE)
str(fr)
#> 'data.frame': 934 obs. of 3 variables:
#> $ w : num 0.001 0.001 0.001 0.001 0.001 0.001 0.001 0.001 0.001 0.001 ...
#> $ value : num 2.67 1.11 3.87 4.24 3.4 ...
#> $ Species: chr "Sprat" "Sandeel" "N.pout" "Herring" ...
# }
# Returning the data frame
fr <- plotPredMort(sim, return_data = TRUE)
str(fr)
#> 'data.frame': 934 obs. of 3 variables:
#> $ w : num 0.001 0.001 0.001 0.001 0.001 0.001 0.001 0.001 0.001 0.001 ...
#> $ value : num 2.67 1.11 3.87 4.24 3.4 ...
#> $ Species: chr "Sprat" "Sandeel" "N.pout" "Herring" ...
# }