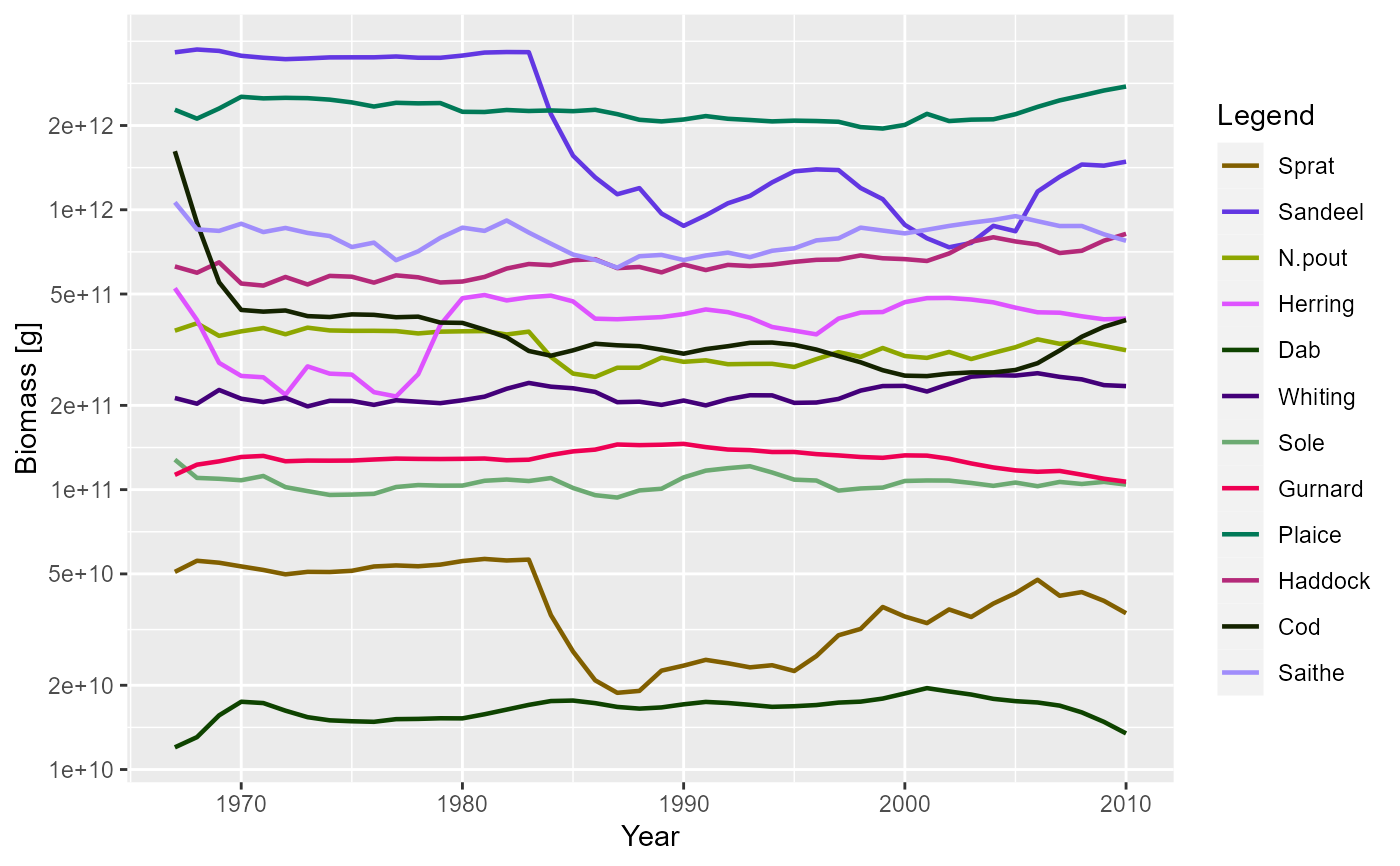
After running a projection, the biomass of each species can be plotted
against time. The biomass is calculated within user defined size limits
(min_w, max_w, min_l, max_l, see getBiomass()).
Usage
plotBiomass(
  sim,
  species = NULL,
  start_time,
  end_time,
  y_ticks = 6,
  ylim = c(NA, NA),
  total = FALSE,
  background = TRUE,
  highlight = NULL,
  return_data = FALSE,
  ...
)

plotlyBiomass(
  sim,
  species = NULL,
  start_time,
  end_time,
  y_ticks = 6,
  ylim = c(NA, NA),
  total = FALSE,
  background = TRUE,
  highlight = NULL,
  ...
)
Arguments
- sim
An object of class MizerSim
- species
The species to be selected. Optional. By default all target species are selected. A vector of species names, or a numeric vector with the species indices, or a logical vector indicating for each species whether it is to be selected (TRUE) or not.
- start_time
The first time to be plotted. Default is the beginning of the time series.
- end_time
The last time to be plotted. Default is the end of the time series.
- y_ticks
The approximate number of ticks desired on the y axis
- ylim
A numeric vector of length two providing lower and upper limits for the y axis. Use NA to refer to the existing minimum or maximum. Any values below 1e-20 are always cut off.
- total
A boolean value that determines whether the total biomass from all species is plotted as well. Default is FALSE.
- background
A boolean value that determines whether background species are included. Ignored if the model does not contain background species. Default is TRUE.
- highlight
Name or vector of names of the species to be highlighted.
- return_data
A boolean value that determines whether the formatted data used for the plot is returned instead of the plot itself. Default value is FALSE
- ...
Arguments passed on to
get_size_range_arraymin_wSmallest weight in size range. Defaults to smallest weight in the model.
max_wLargest weight in size range. Defaults to largest weight in the model.
min_lSmallest length in size range. If supplied, this takes precedence over
min_w.max_lLargest length in size range. If supplied, this takes precedence over
max_w.
Value
A ggplot2 object, unless return_data = TRUE, in which case a data
frame with the four variables 'Year', 'Biomass', 'Species', 'Legend' is
returned.
See also
plotting_functions, getBiomass()
Other plotting functions:
animateSpectra(),
plot,MizerSim,missing-method,
plotDiet(),
plotFMort(),
plotFeedingLevel(),
plotGrowthCurves(),
plotPredMort(),
plotSpectra(),
plotYield(),
plotYieldGear(),
plotting_functions
Examples
# \donttest{
plotBiomass(NS_sim)
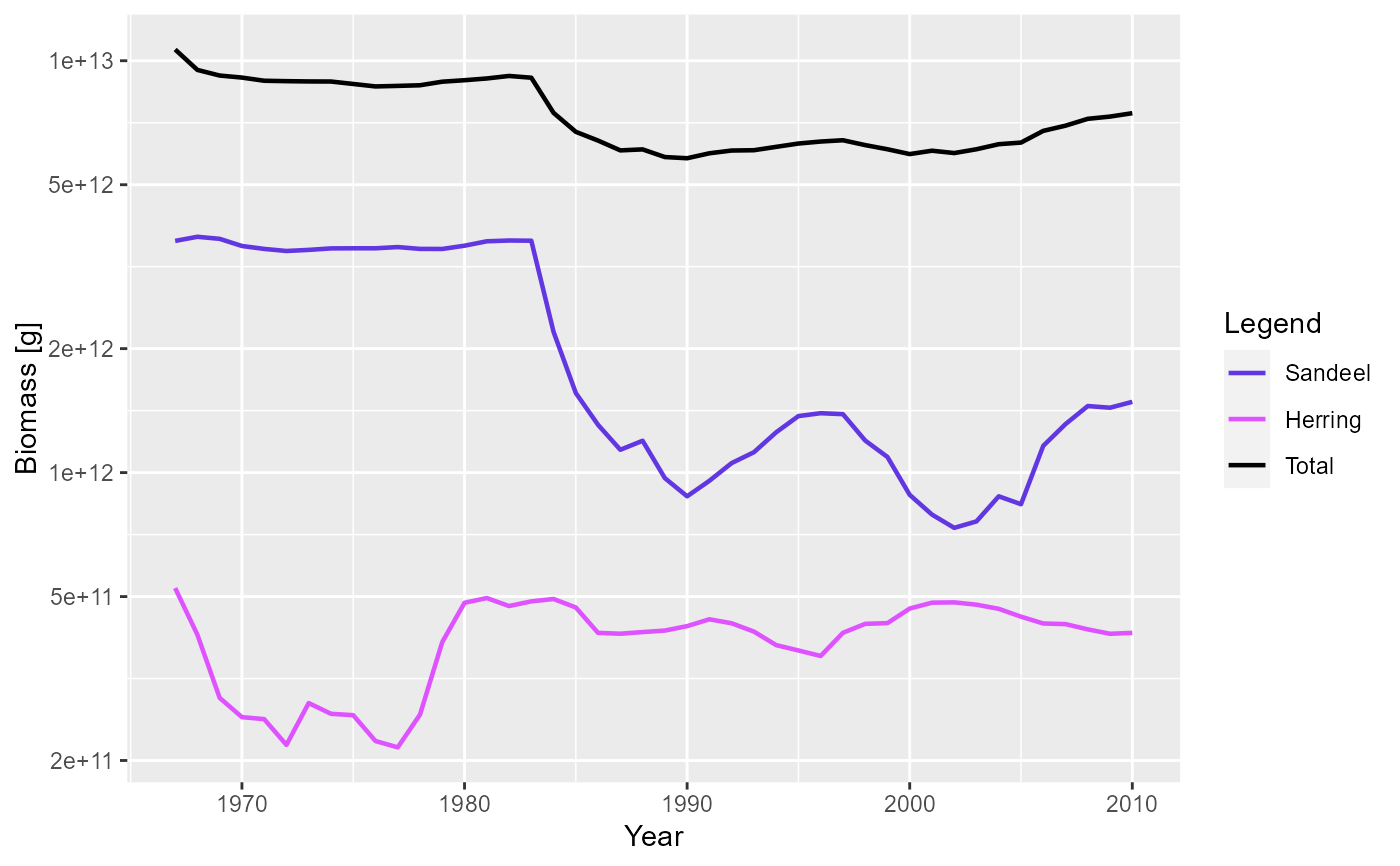
 plotBiomass(NS_sim, species = c("Sandeel", "Herring"), total = TRUE)
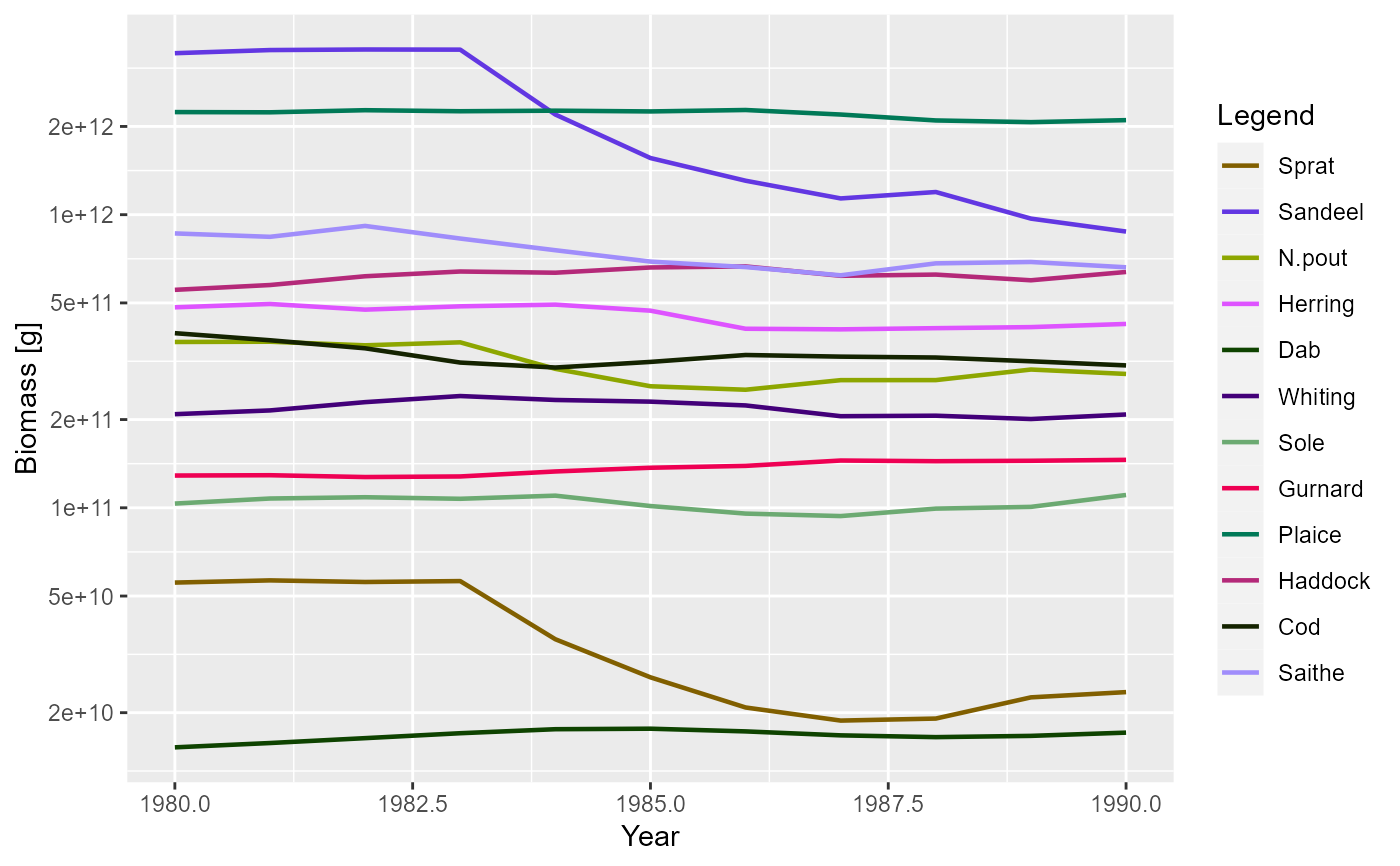
 plotBiomass(NS_sim, start_time = 1980, end_time = 1990)
 # Returning the data frame
fr <- plotBiomass(NS_sim, return_data = TRUE)
str(fr)
#> 'data.frame': 528 obs. of 4 variables:
#> $ Year : int 1967 1968 1969 1970 1971 1972 1973 1974 1975 1976 ...
#> $ Biomass: num 5.08e+10 5.57e+10 5.48e+10 5.32e+10 5.16e+10 ...
#> $ Species: Factor w/ 12 levels "Sprat","Sandeel",..: 1 1 1 1 1 1 1 1 1 1 ...
#> $ Legend : Factor w/ 12 levels "Sprat","Sandeel",..: 1 1 1 1 1 1 1 1 1 1 ...
# }
# Returning the data frame
fr <- plotBiomass(NS_sim, return_data = TRUE)
str(fr)
#> 'data.frame': 528 obs. of 4 variables:
#> $ Year : int 1967 1968 1969 1970 1971 1972 1973 1974 1975 1976 ...
#> $ Biomass: num 5.08e+10 5.57e+10 5.48e+10 5.32e+10 5.16e+10 ...
#> $ Species: Factor w/ 12 levels "Sprat","Sandeel",..: 1 1 1 1 1 1 1 1 1 1 ...
#> $ Legend : Factor w/ 12 levels "Sprat","Sandeel",..: 1 1 1 1 1 1 1 1 1 1 ...
# }