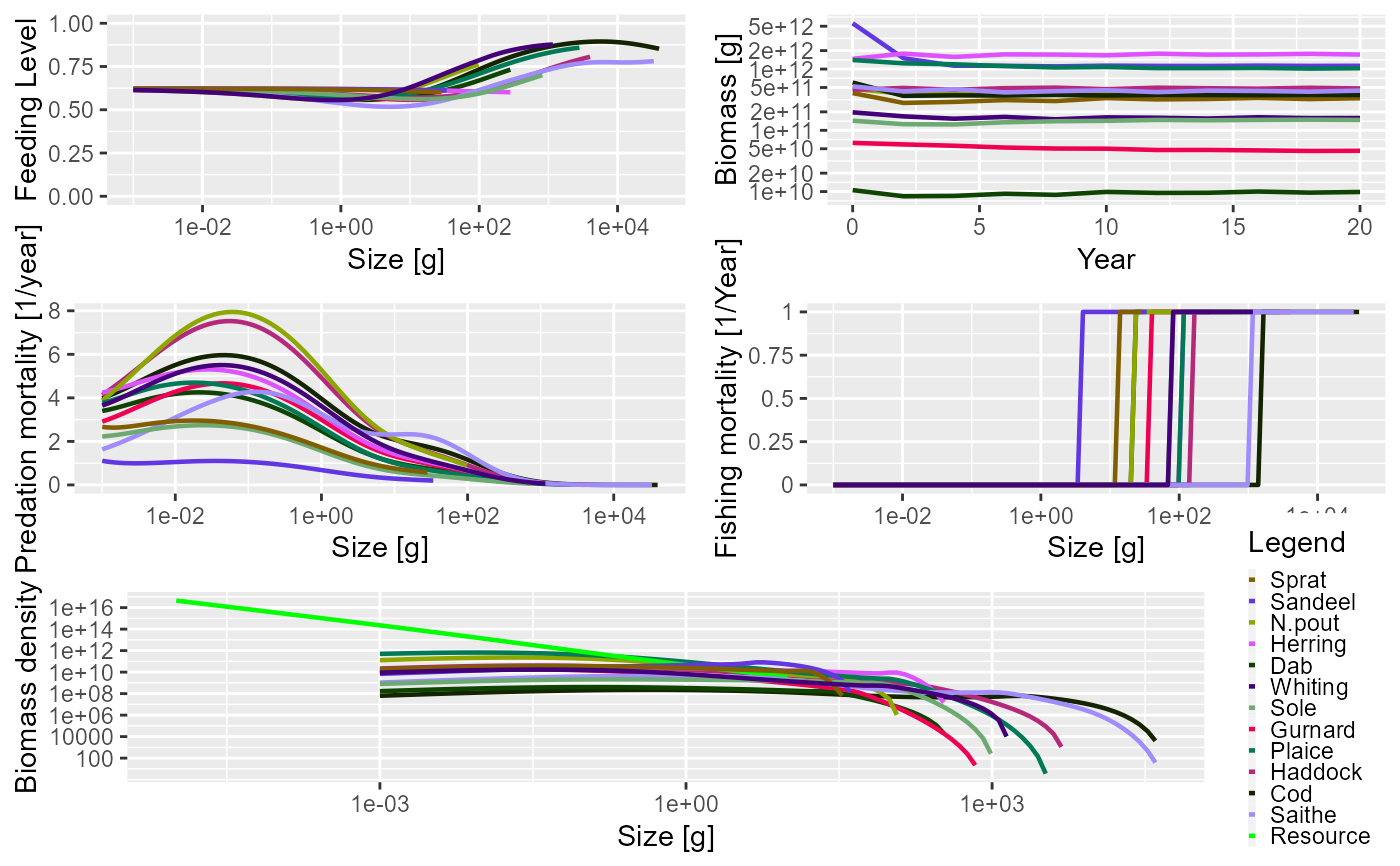
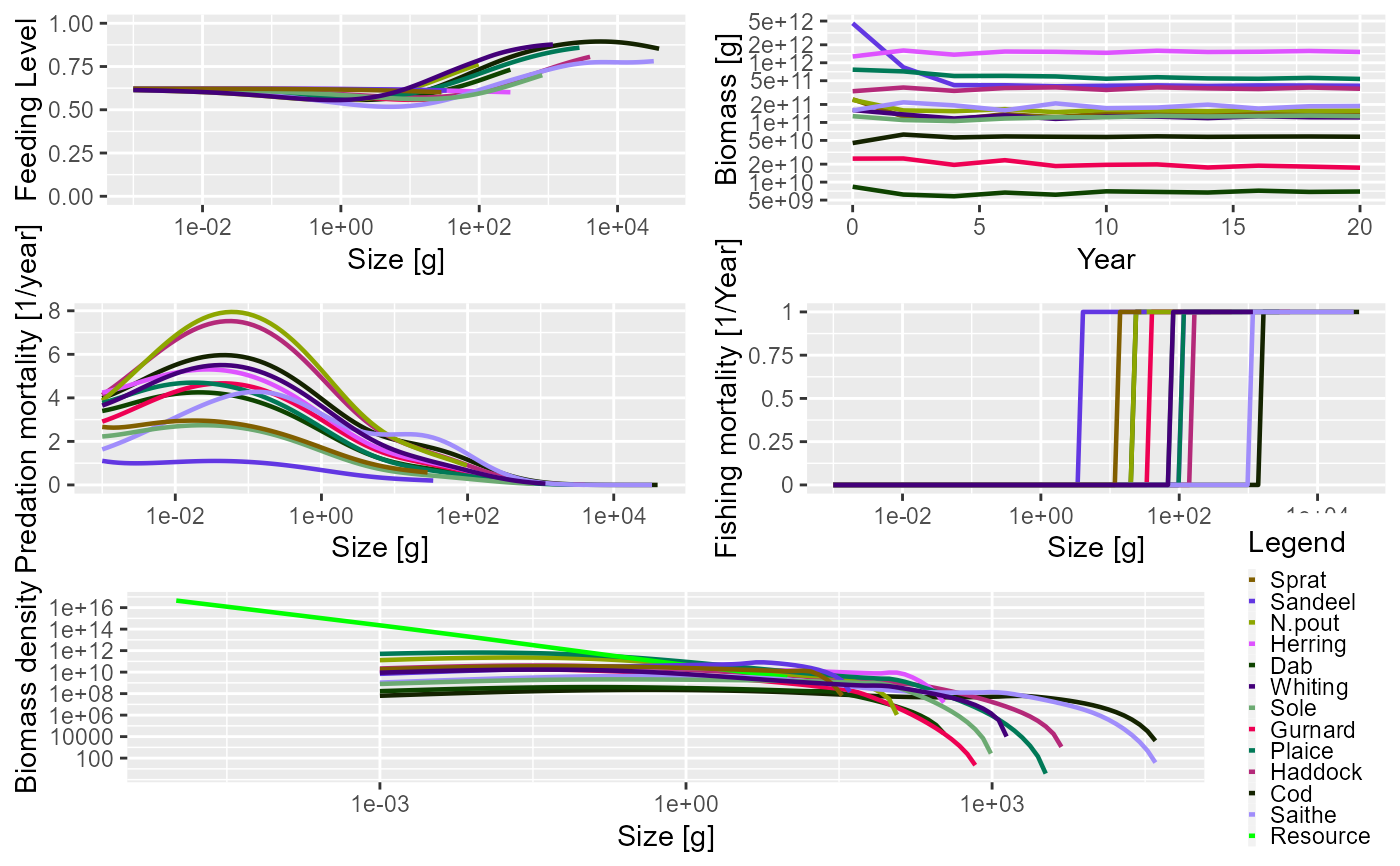
After running a projection, produces 5 plots in the same window: feeding level, abundance spectra, predation mortality and fishing mortality of each species by size; and biomass of each species through time. This method just uses the other plotting functions and puts them all in one window.
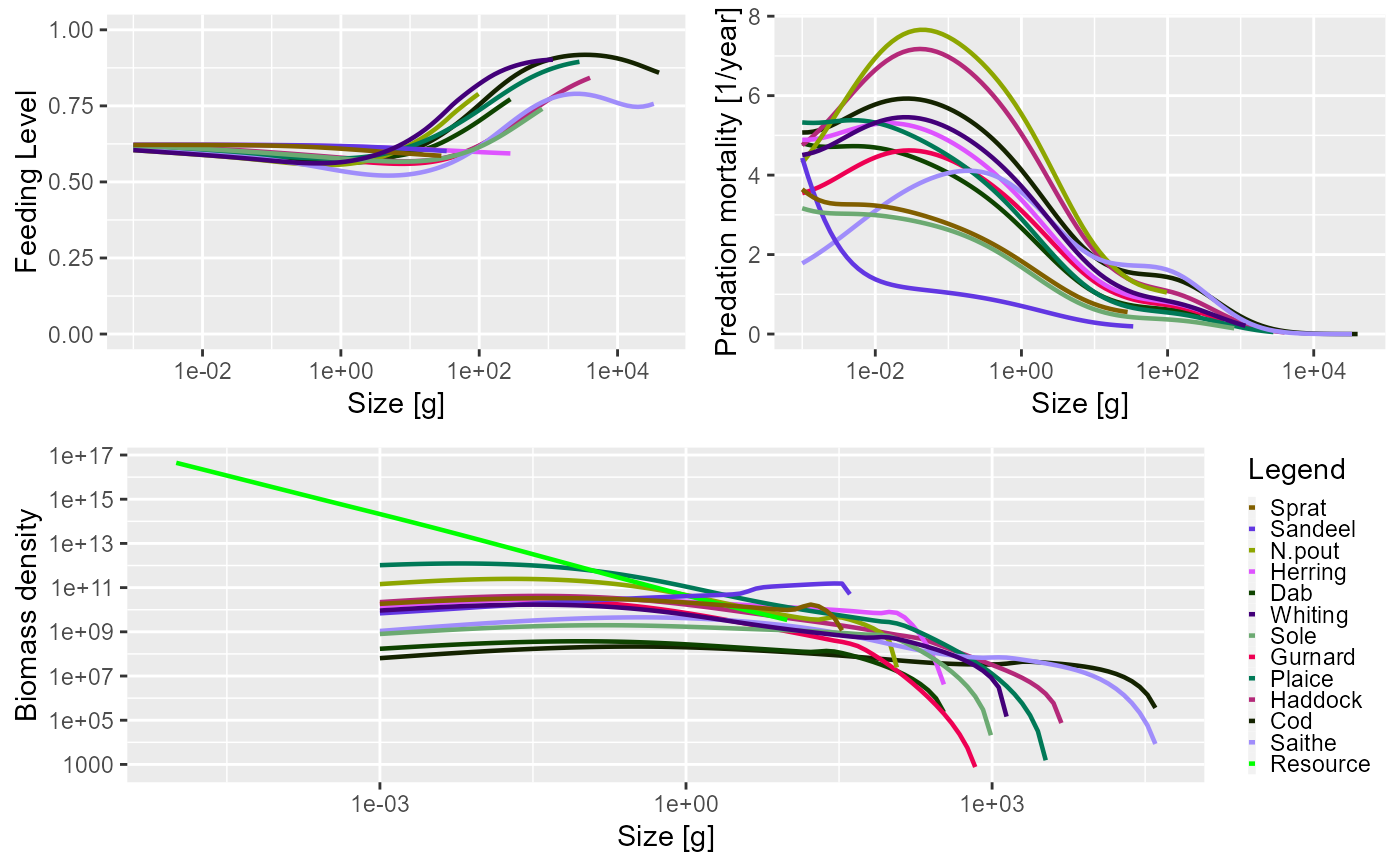
Produces 3 plots in the same window: abundance spectra, feeding level and predation mortality of each species through time. This method just uses the other plotting functions and puts them all in one window.
Arguments
- x
An object of class MizerSim
- y
Not used
- ...
For additional arguments see the documentation for
plotBiomass(),plotFeedingLevel(),plotSpectra(),plotPredMort()andplotFMort().
See also
Other plotting functions:
animateSpectra(),
plotBiomass(),
plotDiet(),
plotFMort(),
plotFeedingLevel(),
plotGrowthCurves(),
plotPredMort(),
plotSpectra(),
plotYield(),
plotYieldGear(),
plotting_functions
Other plotting functions:
animateSpectra(),
plotBiomass(),
plotDiet(),
plotFMort(),
plotFeedingLevel(),
plotGrowthCurves(),
plotPredMort(),
plotSpectra(),
plotYield(),
plotYieldGear(),
plotting_functions
Examples
# \donttest{
params <- NS_params
sim <- project(params, effort=1, t_max=20, t_save = 2, progress_bar = FALSE)
plot(sim)
 plot(sim, time_range = 10:20) # change time period for size-based plots
 plot(sim, min_w = 10, max_w = 1000) # change size range for biomass plot
 # }
# \donttest{
params <- NS_params
plot(params)
# }
# \donttest{
params <- NS_params
plot(params)
 plot(params, min_w = 10, max_w = 1000) # change size range for biomass plot
 # }
# }