This is a generic function with methods for objects of class
MizerSim and MizerParams. The method for a
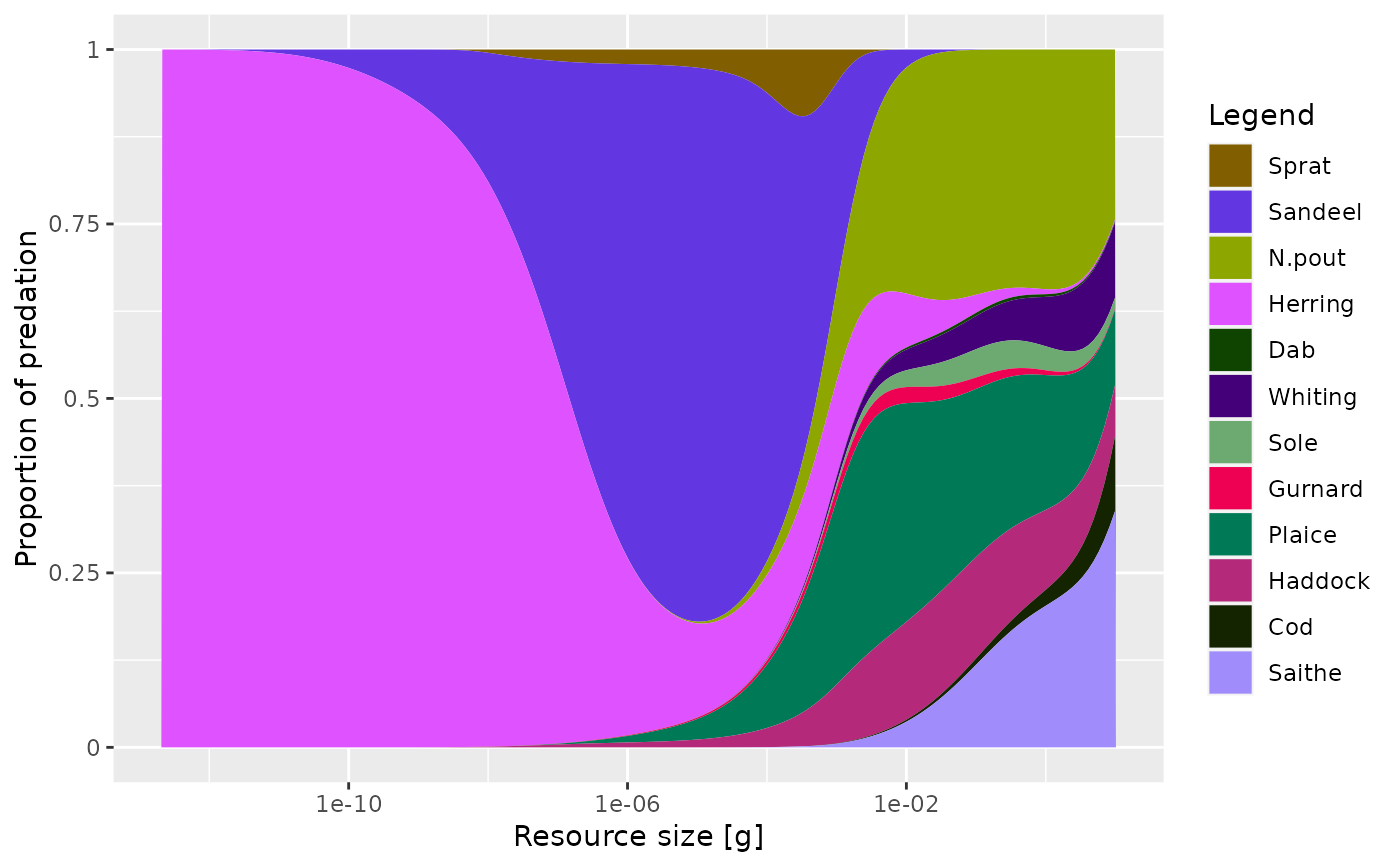
MizerSim object plots the mortality in the initial state of the
simulation. An interactive version is available as plotlyResourcePred().
Usage
plotResourcePred(object, proportion = TRUE, return_data = FALSE, ...)

plotlyResourcePred(object, proportion = TRUE, ...)
Arguments
- object
An object of class MizerSim or MizerParams.
- proportion
A boolean value that determines whether values should be displayed as proportions from 0 to 1 or with their actual values. Default is TRUE.
- return_data
A boolean value that determines whether the formatted data used for the plot is returned instead of the plot itself. Default value is FALSE
- ...
Other arguments (currently unused)
Value
A ggplot2 object, unless return_data = TRUE, in which case a data
frame with the four variables 'w', 'value', 'Predator', 'Resource' is
returned.
See also
Other plotting functions:
plotDeath(),
plotEnergyBudget(),
plotResourceLevel(),
plotYieldVsF(),
plotYieldVsSize()
Examples
# \donttest{
plotResourcePred(NS_params)


# Returning the data frame
fr <- plotResourcePred(NS_params, return_data = TRUE)
str(fr)
#> 'data.frame':	2148 obs. of  3 variables:
#>  $ w       : num  2.12e-13 2.12e-13 2.12e-13 2.12e-13 2.12e-13 ...
#>  $ value   : num  7.00e-12 5.07e-05 8.17e-11 1.00 8.69e-13 ...
#>  $ Predator: Factor w/ 12 levels "Sprat","Sandeel",..: 1 2 3 4 5 6 7 8 9 10 ...
# }
# Returning the data frame
fr <- plotResourcePred(NS_params, return_data = TRUE)
str(fr)
#> 'data.frame': 2148 obs. of 3 variables:
#> $ w : num 2.12e-13 2.12e-13 2.12e-13 2.12e-13 2.12e-13 ...
#> $ value : num 7.00e-12 5.07e-05 8.17e-11 1.00 8.69e-13 ...
#> $ Predator: Factor w/ 12 levels "Sprat","Sandeel",..: 1 2 3 4 5 6 7 8 9 10 ...
# }