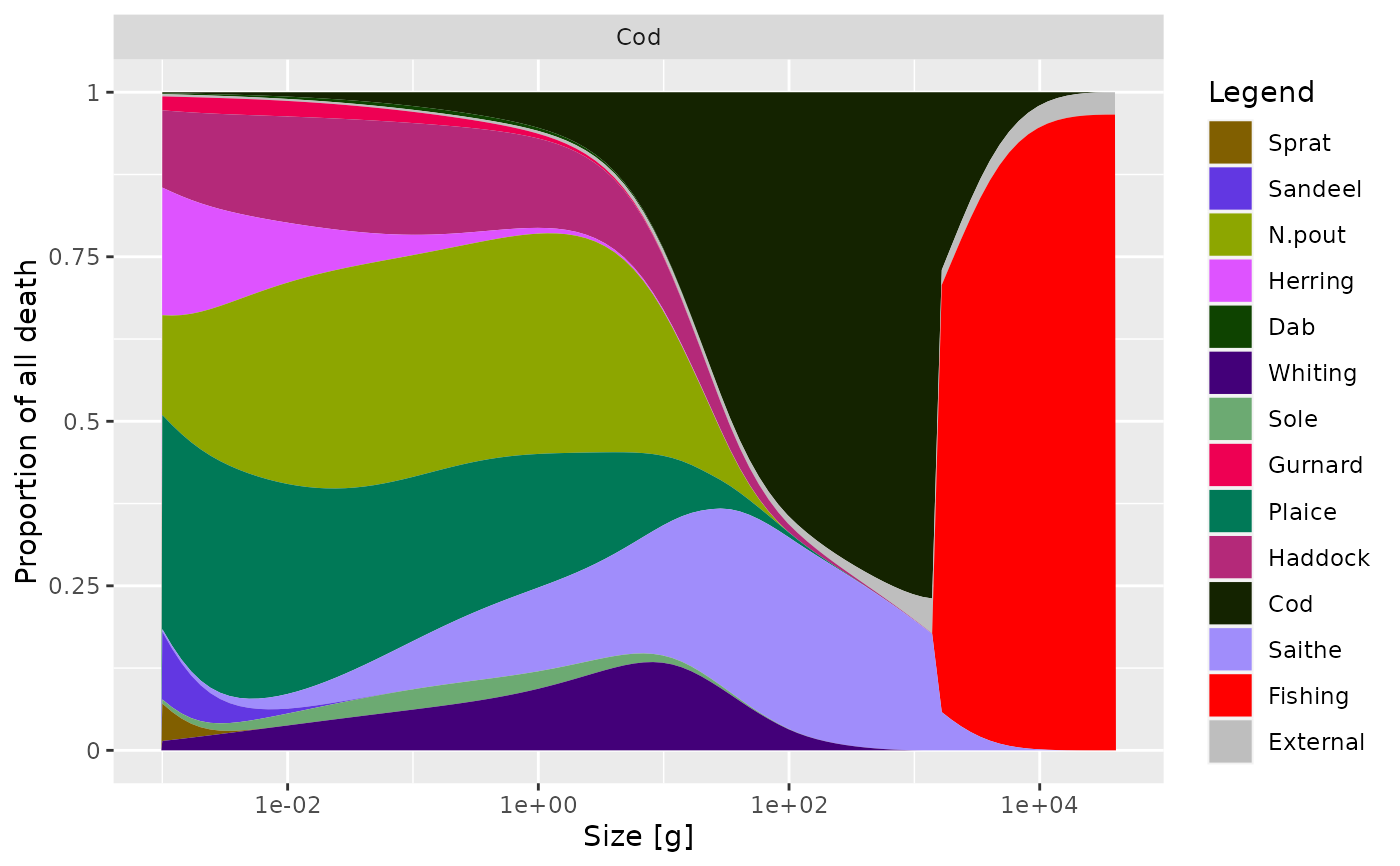
Plot the sources of external, predation and fishing mortality per species and size
Source:R/plots.R
plotDeath.RdThis is a generic function with methods for objects of class
MizerSim and MizerParams. The method for a
MizerSim object plots the mortality in the initial state of the
simulation. An interactive version is available as plotlyDeath().
Usage
plotDeath(
  object,
  species = NULL,
  proportion = TRUE,
  return_data = FALSE,
  xtrans = c("log10", "identity"),
  ...
)

plotlyDeath(object, species = NULL, proportion = TRUE, ...)
Arguments
- object
An object of class MizerSim or MizerParams.
- species
The name of the predator species for which to plot the mortality.
- proportion
A boolean value that determines whether values should be displayed as proportions from 0 to 1 or with their actual values. Default is TRUE.
- return_data
A boolean value that determines whether the formatted data used for the plot is returned instead of the plot itself. Default value is FALSE
- xtrans
The transformation to apply to the x-axis. Either "log10" (default) or "identity".
- ...
Other arguments (currently unused)
Value
A ggplot2 object, unless return_data = TRUE, in which case a data
frame with the four variables 'w', 'value', 'Cause', 'Species' is returned.
See also
Other plotting functions:
plotEnergyBudget(),
plotResourceLevel(),
plotResourcePred(),
plotYieldVsF(),
plotYieldVsSize()
Examples
# \donttest{
plotDeath(NS_params, species = "Cod")


# Returning the data frame
fr <- plotDeath(NS_params, species = "Cod", return_data = TRUE)
str(fr)
#> 'data.frame':	1400 obs. of  4 variables:
#>  $ w    : num  0.001 0.00119 0.00142 0.0017 0.00203 ...
#>  $ value: num  0.00345 0.00345 0.00344 0.00341 0.00338 ...
#>  $ Cause: chr  "External" "External" "External" "External" ...
#>  $ Prey : chr  "Cod" "Cod" "Cod" "Cod" ...
# }
# Returning the data frame
fr <- plotDeath(NS_params, species = "Cod", return_data = TRUE)
str(fr)
#> 'data.frame': 1400 obs. of 4 variables:
#> $ w : num 0.001 0.00119 0.00142 0.0017 0.00203 ...
#> $ value: num 0.00345 0.00345 0.00344 0.00341 0.00338 ...
#> $ Cause: chr "External" "External" "External" "External" ...
#> $ Prey : chr "Cod" "Cod" "Cod" "Cod" ...
# }