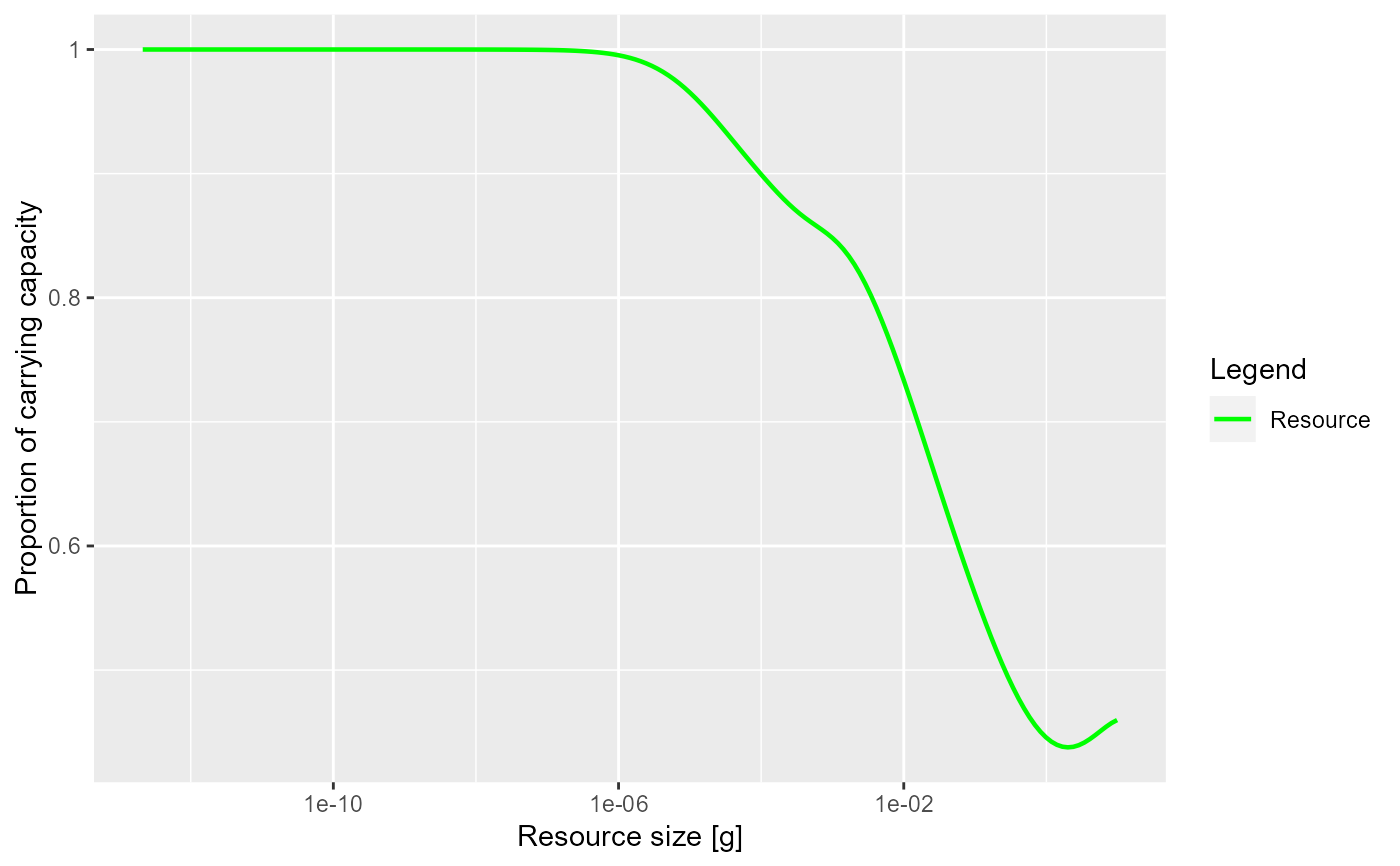
Plot the proportion of the resource spectrum(s) compared to their carrying capacity
Source:R/plotResource.R
plotResourceLevel.RdPlot the proportion of the resource spectrum(s) compared to their carrying capacity
Arguments
- object
An object of class MizerSim or MizerParams.
- return_data
A boolean value that determines whether the formatted data used for the plot is returned instead of the plot itself. Default value is FALSE
Value
A ggplot2 object, unless return_data = TRUE, in which case a data
frame with the three variables 'w', 'value', 'Resource' is returned.
See also
Other plotting functions:
animateSpectra,
plotDiet,
plotResourcePred(),
plotSpectra
Examples
# \donttest{
plotResourceLevel(NS_params)


# Returning the data frame
fr <- plotResourceLevel(NS_params, return_data = TRUE)
str(fr)
#> 'data.frame':	179 obs. of  3 variables:
#>  $ w       : num  2.12e-13 2.53e-13 3.02e-13 3.61e-13 4.30e-13 ...
#>  $ value   : num  1 1 1 1 1 ...
#>  $ Resource: chr  "Resource" "Resource" "Resource" "Resource" ...
# }
# Returning the data frame
fr <- plotResourceLevel(NS_params, return_data = TRUE)
str(fr)
#> 'data.frame': 179 obs. of 3 variables:
#> $ w : num 2.12e-13 2.53e-13 3.02e-13 3.61e-13 4.30e-13 ...
#> $ value : num 1 1 1 1 1 ...
#> $ Resource: chr "Resource" "Resource" "Resource" "Resource" ...
# }