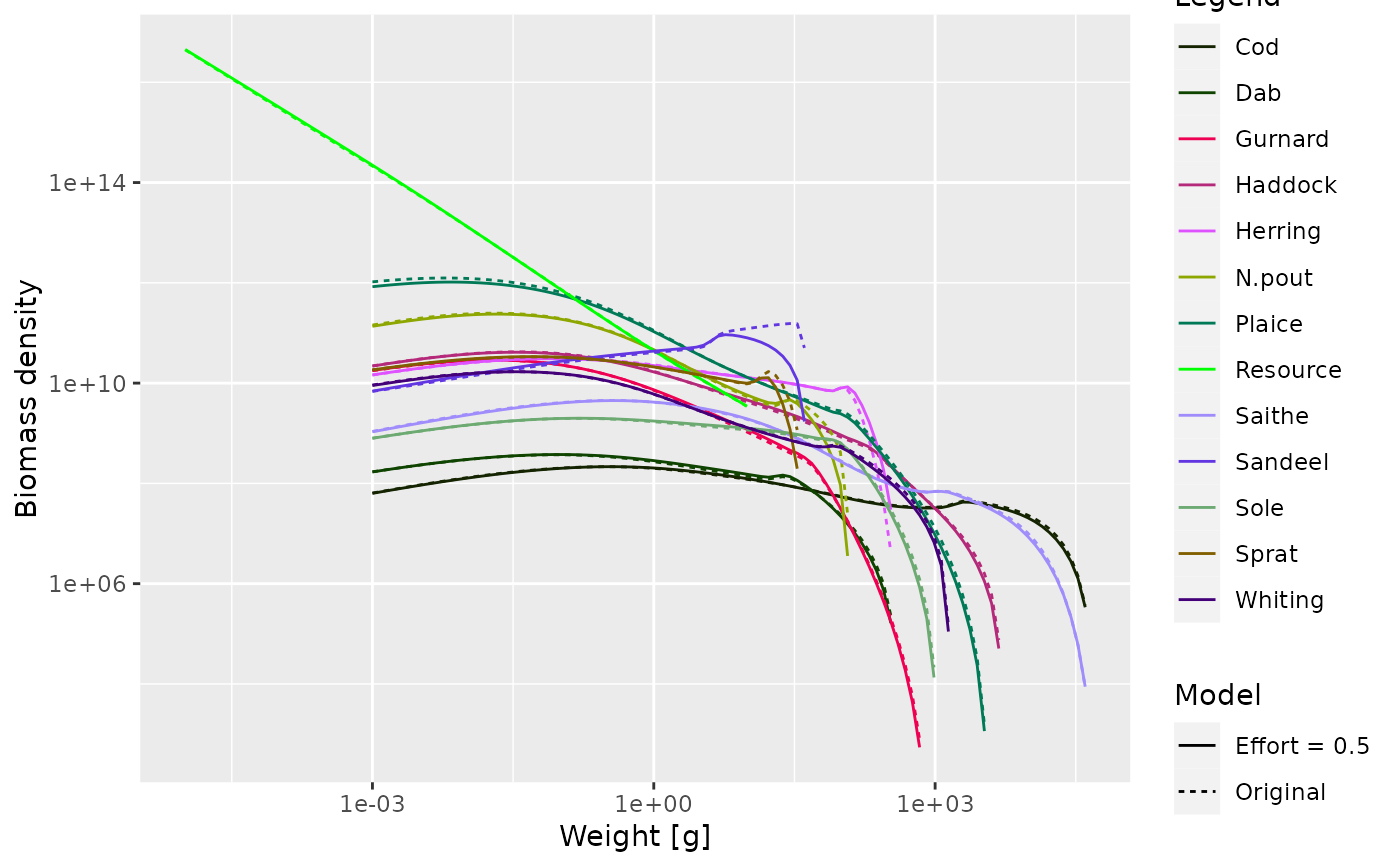
Show two size spectra in the same plot
Arguments
- object1
First MizerParams or MizerSim object.
- object2
Second MizerParams or MizerSim object.
- name1
An optional string with the name for the first model, to be used in the legend. Set to "First" by default.
- name2
An optional string with the name for the second model, to be used in the legend. Set to "Second" by default.
- power
The abundance is plotted as the number density times the weight raised to this power. The default power = 1 gives the biomass density, whereas power = 2 gives the biomass density with respect to logarithmic size bins.
- ...
Parameters to pass to
plotSpectra()
