![[Deprecated]](figures/lifecycle-deprecated.svg) A similar plot can now be produced with
mizer's
A similar plot can now be produced with
mizer's mizer::plotRelative(), which works directly on the arrays returned
by mizer::getBiomass(), for example
plotRelative(getBiomass(sim_original), getBiomass(sim)). Note that
mizer::plotRelative() shows the symmetric relative difference
\(2(N_2 - N_1)/(N_1 + N_2)\) rather than the percentage change relative to
the reference.
Usage
plotBiomassRelative(sim, sim_original = NULL, species = NULL, ...)

plotlyBiomassRelative(sim, sim_original = NULL, species = NULL, ...)
Arguments
- sim
A MizerSim object
- sim_original
Another MizerSim object to compare the biomasses to. If NULL (default) then the biomasses are compared to the initial biomasses in
sim.- species
The species to be selected. Optional. By default all target species are selected. A vector of species names, or a numeric vector with the species indices, or a logical vector indicating for each species whether it is to be selected (TRUE) or not.
- ...
Parameters passed to
getBiomass()
Examples
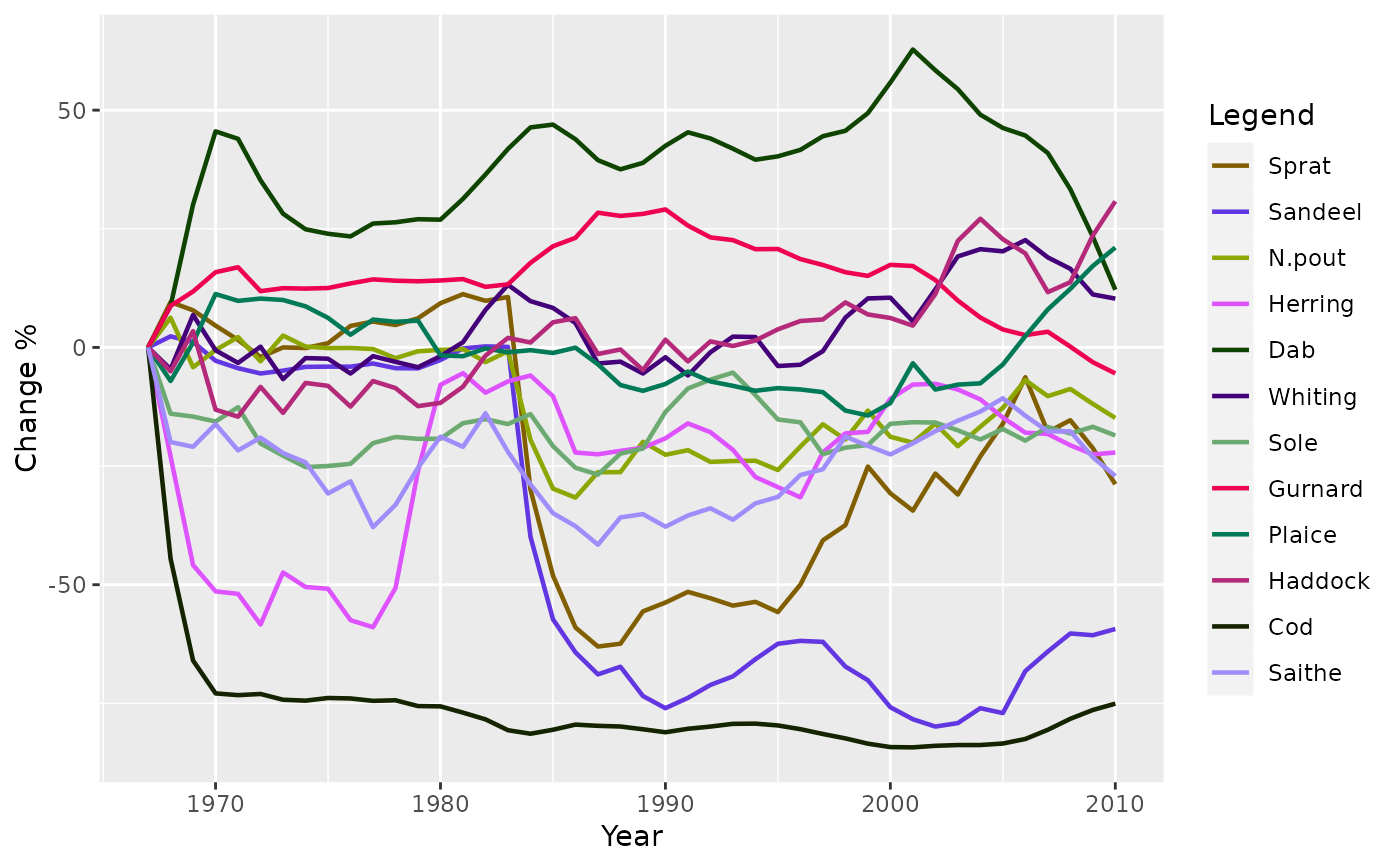
plotBiomassRelative(NS_sim)
#> Warning: `plotBiomassRelative()` was deprecated in mizerExperimental 3.0.0.
#> ℹ Please use `mizer::plotRelative()` instead.
#> ℹ For example `plotRelative(getBiomass(sim_original), getBiomass(sim))`.
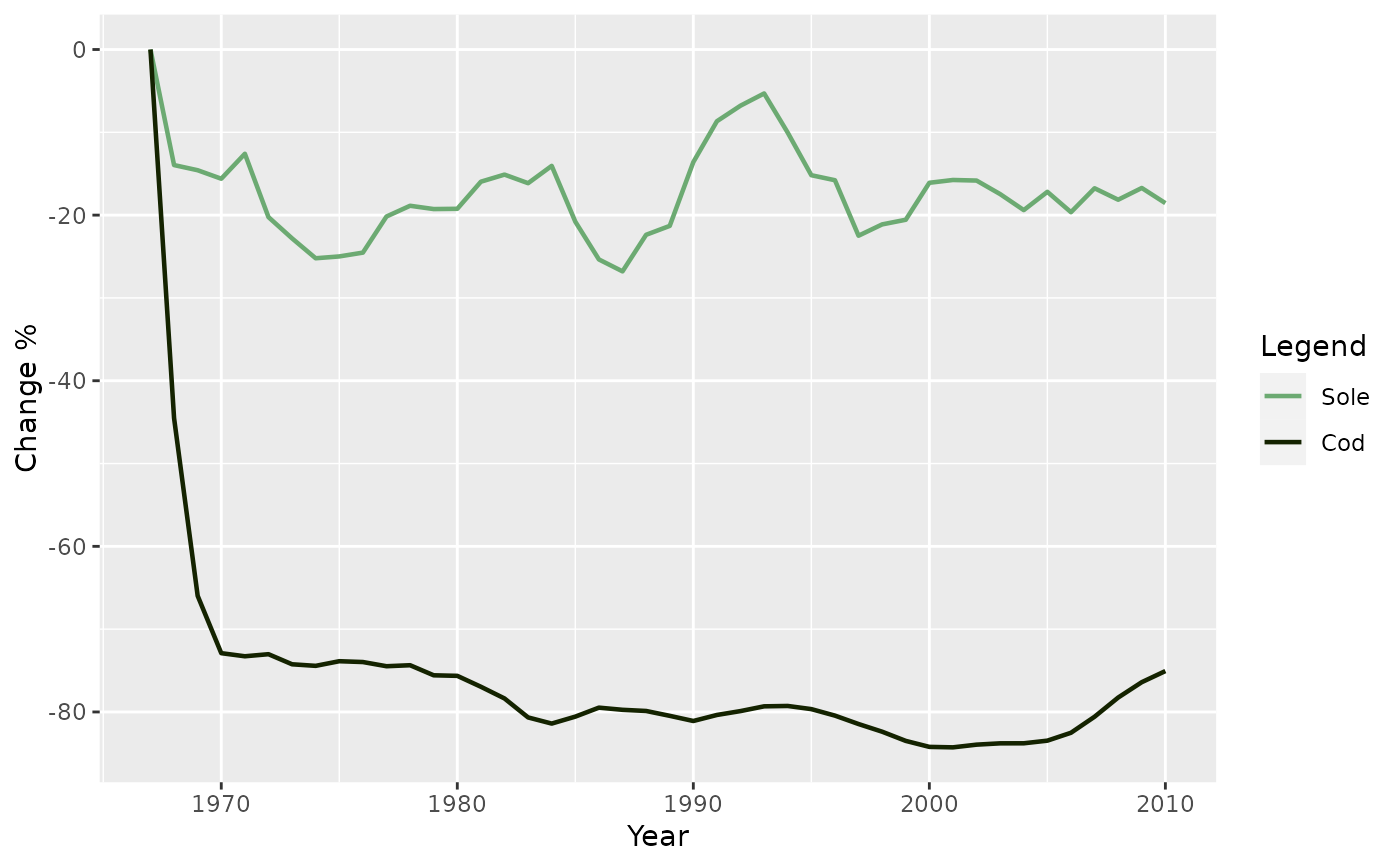
 plotBiomassRelative(NS_sim, species = c("Cod", "Sole"))