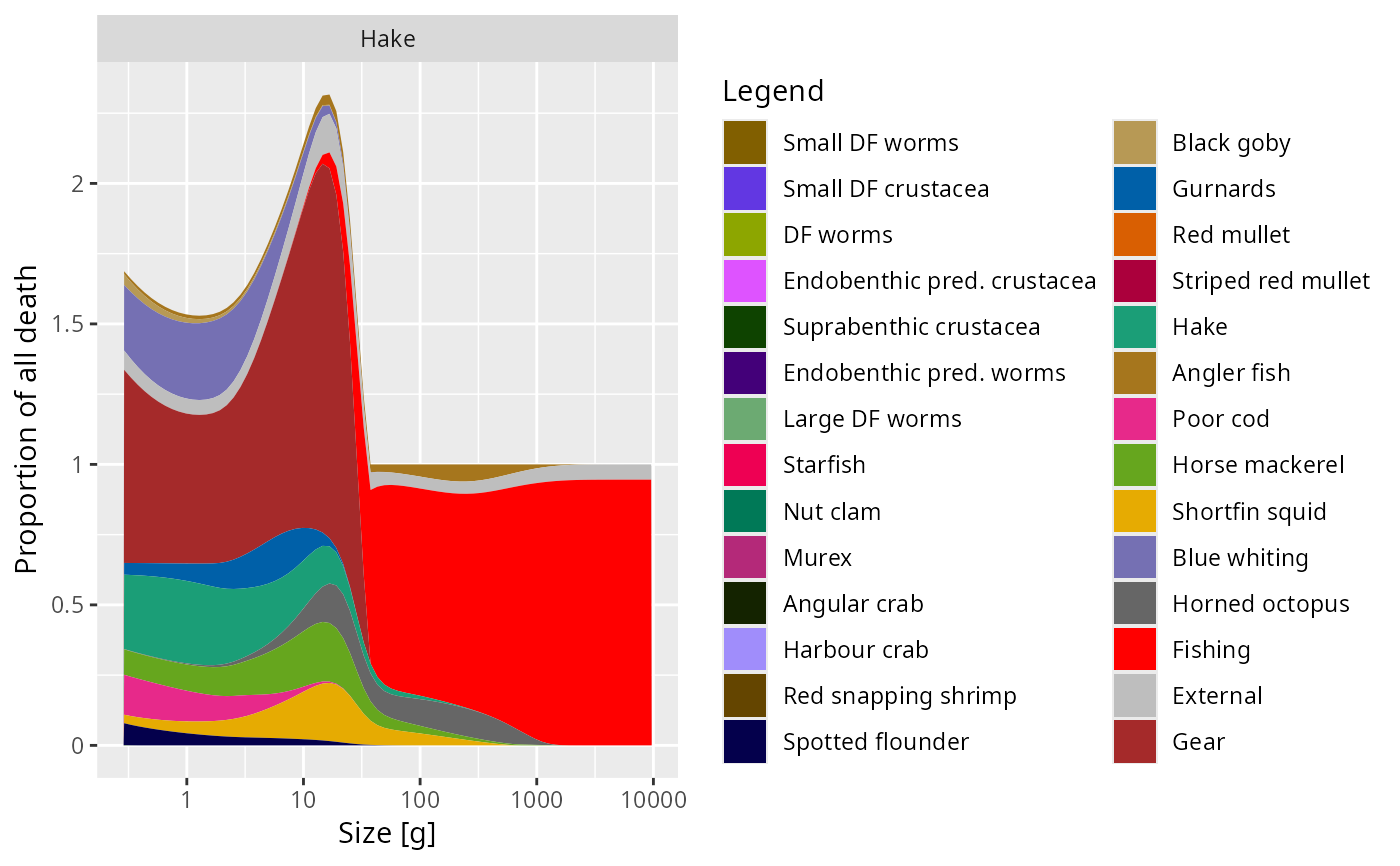
Plot death rates
Usage
plotDeath(object, species = NULL, proportion = TRUE, return_data = FALSE)

plotlyDeath(object, species = NULL, proportion = TRUE, ...)
Arguments
- object
A MizerSim or MizerParams object.
- species
A character vector of species to plot. If NULL, all species in the model will be plotted.
- proportion
A logical value indicating whether to plot death rates as proportions of total mortality.
- return_data
A logical value indicating whether to return the data used to plot.